PDF of this article (236 KB)
Though the deepsea floor around New Zealand may look like a desert, initial results from a wide-sweeping new survey point to a surprising abundance of life. Scott Nodder, Don Robertson, and David Bowden describe how the results were gathered in thisimportant investigation of New Zealand’s EEZ.
It’s one of the largest habitats on earth, but the muddy sediments of the deepsea floor still hold many mysteries, and the factors driving habitat and biodiversity variability in these environments are poorly known. The animals at the bottom of the deep sea inhabit an environment that’s entirely in hospitable from a human perspective: it’s perpetually dark, cold, and under crushing water pressure. Despite the barren appearance of the deepsea sediments, we’re learning that there’s greater biological diversity on the ocean floor than once was thought.
Ocean Survey 20/20
Last year, we began the first systematic survey of such deepsea habitats in New Zealand’s Exclusive Economic Zone (EEZ) as part of Ocean Survey 20/20 (OS 20/20). Over the next 15 years, this ambitious government-funded programme, will map the seafloor habitats and biodiversity of New Zealand’s marine environment across large areas of the EEZ. To achieve its goals, OS 20/20 draws on expertise from several government departments and crown research institutes, including Land Information NZ (LINZ), Ministry of Fisheries (MFish), Department of Conservation (DOC), NIWA, and GNS Science.
The initial OS 20/20 project focused on two large, deep ocean domains: Chatham Rise to the east of the New Zealandlandmass, and Challenger Plateau to the west. These voyages revealed diverse and abundant biological communities living in a range of environments – from rugged seamounts and reefs to plains of muddy sediment and current-scoured sands at depths of over a kilometre.
The Chatham–Challenger project kicks off
The Chatham–Challenger project involved three separate voyages of NIWA's research vessel Tangaroa. The first, in August 2006, was to get the lie of the land. Using a multi-beam echo-sounder, we mapped a number of transects (lines) across recognised physical, chemical, and biological gradients. These echo-sounder data gave us a detailed picture of seafloor bathymetry (contours) and composition (hard or soft surfaces) from which we were able to identify broad habitat differences (such as steep versus low slopes, rock versus mud sediment types). We used these data to plan for two voyages in April–June 2007 in which we sampled the biological communities associated with the different habitats.
Deciding where to sample
We developed our sampling strategy by combining the multibeam data from our initial seafloor survey with environmental variables, including surface chlorophyll a concentrations (an indicator of primary productivity in the ocean) from satellite observations and modelled tidal currents. This data analysis gave us a number of environmental categories representing distinct seafloor habitats.
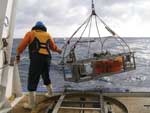
Then we sampled these distinct habitats at three levels of intensity. At every sampling site we used NIWA’s deep towed imaging system (DTIS) camera platform, which records continuous high-definition video of the seafloor and high-resolution still images at regular intervals. In conjunction with the DTIS, we used our ‘seamount sled’, a device that collects samples of organisms as we tow it short distances along the seafloor. In the trade, this is known as an epibenthic sled (epi=near, benthic=bottom); the samples it collects confirm what we see in the video images. At some of the sites we deployed a broader suite of sampling gear. And for at least one site in each habitat, we sampled with a full range of equipment, including DTIS, the epibenthic sled, a hyperbenthic sled to collect macroscopic fauna just above the seabed (macroscopic=large enough to see without a microscope), and sediment corers to sample organisms, bacteria, and physical properties of the sediment itself.
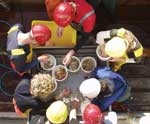
Onboard Tangaroa, we identified the samples as far as possible, and counted, labelled, and preserved them for future taxonomic and scientific study. For marine biological expertise and scientific knowledge onboard the ship we had 25–30 researchers from several New Zealand institutions, including NIWA, MFish, DOC, University of Waikato, and University of Otago.
Initial results
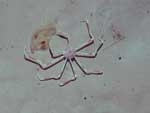
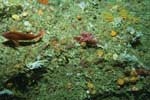
It will be at least a year before the samples from these voyages are identified and only then can we begin the full analyses of biodiversity and distribution. However, some broad-scalepatterns are clear from the raw data. For instance, we can begin to visualise relationships between habitat type and faunal biodiversity based on the nearly 170 one-hour camera transects across both study areas (see example below). From real-time observations like this, it’s clear that the Chatham Rise has more diverse substrate types than the Challenger Plateau. The diversity of biological communities is often correlated with habitat complexity and we might, therefore, expect the Chatham Rise to harbour greater biodiversity. However, habitat complexity operates on many scales, and what first appeared to be a uniform expanse of soft muddy sediments across much of the Challenger Plateau turned out to be covered by a dense and finely structured mosaic of animal tracks and burrows. These signs of life indicate high abundance – and potentially high diversity – of benthic animals within the sediment.
The way ahead
We’ll spend the next three years analysing the Chatham–Challenger OS 20/20 samples. Our research will concentrate on mapping biodiversity in relation to substrate type across the study areas and will explore the potential for using higher-level remote sensing methods such as multi-beam mapping for predicting the distribution of seafloor biological communities. The OS 20/20 data will also be used to develop and refine the Marine Environment Classification (MEC), another government-funded NIWA initiative, and thus will be an important contribution to future resource-management strategies for New Zealand’s EEZ.
Life in the deep
- Ocean Survey 20/20 is a major, multi-agency programme to survey biodiversity in New Zealand's EEZ by the year 2020.
- Initial results are in for the first component of the programme: an investigation in 2007 of Chatham Rise and Challenger Plateau.
- Scientists are now analysing over 4 tonnes of biological samples brought back from two voyages.
A survey based on intensive sampling
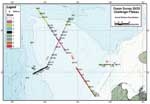
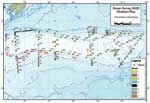
During the voyages in 2007, we made nearly 300 gear deployments at 104 different locations on Chatham Rise, and 140 deployments at nearly 50 sites on Challenger Plateau. We sorted over 11 tonnes of seafloor material, and retained almost 4 tonnes of biological specimens sorted into over 4000 individual sample lots for taxonomic identification.
Station locations and multi-beam coverage of Challenger Plateau (above) and Chatham Rise (below). We compared these two regions, in part, because in a physical environmental modelling study they share similarities despite differences in their physical, biological, and chemical characteristics. The colours along the transects indicate the different habitats (‘strata’) sampled in each study area. (Note: numbering and colouring of strata differ between the two study areas.)
| Chatham Rise | Challenger Plateau | |
|---|---|---|
| Total number sites sampled | 103 | 53 |
| Total number sample lots | 3430 | 1849 |
| Total weight (sorted) | 10 471 kg | 1405 kg |
| Total weight (kept) | 3450 kg | approx 500 kg |
| Total number of taxa | 445 | 219 |
| Most common phyla found | Arthropods (489) | Echinoderms (298) |
| 2nd most common | Echinoderms (452) | Arthropods (296) |
| 3rd most common | Molluscs (397) | Molluscs (221) |
Sampling statistics, including the total number of taxa (order, family, genus, or species) and the top three phyla from each region (total lot numbers in brackets).
Dr Scott Nodder is a marine geologist, Dr Don Robertson is NIWA's General Manager for marine biodiversity, and Dr David Bowden's expertise is in benthic ecology imaging. They are all based at NIWA in Wellington. They are indebted for the success of this project to Neville Ching (NIWA contracts manager), and John Mitchell (ocean geologist), and to the rest of the OS 20/20 project team.
The authors particularly thank the OS 20/20 Steering Group (especially Dr Mary Livingston at MFish) and management of the core agencies for funding: MFish, LINZ, DOC, and NIWA. They gratefully acknowledge the hard work of all voyage participants as well as the many NIWA staff who contributed technical and scientific expertise.
Teachers’ resource for NCEA Achievement Standards or Unit Standards: Biology Level 2 AS90162 Science Level 1 US6349
