Rainfall outlook for December 2001 to February 2002
Average to above average rainfall in the western Pacific, Coral Sea, trending towards average or below average further east and northeast
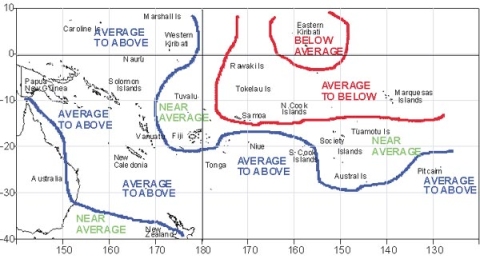
In November the SPCZ was displaced further north than usual east of Samoa, but near its average position elsewhere. However, December through February trade winds are expected to remain slightly enhanced across the central Pacific pushing the SPCZ a little further south than usual. As a result, rainfall is projected to be below average to average in Tokelau, Eastern Kiribati, Samoa, the Northern Cook Islands, and the Marquesas Islands of French Polynesia. Average rainfall is expected in other parts of French Polynesia and Fiji to Tuvalu. Average to above average rainfalls are indicated for most places west of 170�E, including Niue, Tonga, and the Southern Cook Islands.
Rainfall outlook map for December 2001 to February 2002
Probabilities of rainfall departures from average
Broad-scale rainfall patterns and anomalies in the southern tropical Pacific area estimated from the state of large-scale regional climate factors, such as La Niña or El Niño, their effect on the South Pacific and Tropical Convergence Zones, surface and sub-surface sea temperatures, and computer models of the global climate. Rainfall estimates for the next three months for Pacific Islands are given in the adjacent table. The terciles (e.g. 20:30:50) are derived from the interpretation of several global climate models. They correspond to the lowest (driest) one third of the rainfall distribution, the middle one third, and the highest (wettest) one third of the distribution. On the long-term average, rainfall is equally likely (33% chance) in any tercile. The probabilities shown express the expected shift in the distribution from the long-term average, based on predictions of oceanic and atmospheric conditions. The amount of inter-model forecast consistency is indicated by the levels of confidence expressed in the table.
| Island Group | Rainfall Outlook | Confidence in the Outlook |
|---|---|---|
| Papua New Guinea | 10:45:45 Average to Above Average | Moderate |
| Solomon Islands | 10:45:45 Average to Above Average | Moderate |
| Vanuatu | 20:40:40 Average to Above Average | Low |
| Western Kiribati | 20:40:40 Average to Above Average | Low |
| Tonga | 20:40:40 Average to Above Average | Low |
| Niue | 20:40:40 Average to Above Average | Low |
| Southern Cook Islands | 20:40:40 Average to Above Average | Low |
| New Caledonia | 25:35:40 Average to Above Average | Moderate |
| Pitcairn Island | 25:35:40 Average to Above Average | Low |
| Fiji | 30:40:30 Near Average | Low |
| Austral Islands | 25:45:30 Near Average | Moderate |
| Society and Tuamotu Islands | 30:45:25 Near Average | Moderate |
| Tuvalu | 30:40:30 Near Average | Low |
| Wallis and Futuna | 30:40:30 Near Average | Low |
| Northern Cook Islands | 40:40:20 Average to Below Average | Low |
| Marquesas | 40:40:20 Average to Below Average | Moderate |
| Tokelau | 45:45:10 Average to Below Average | Moderate |
| Samoa | 45:45:10 Average to Below Average | Moderate |
| Eastern Kiribati | 50:40:10 Average to Below Average | Moderate |
Rainfall outcomes as estimated from models and historical records. The second column indicates the probability of top (above), middle (average) or bottom (below) tercile rainfall, where a percentage is given. The rainfall outlook is subjectively estimated probability of bottom:middle:top tercile.