As climate change takes hold, regional council planning, sustainability and hazard managers are looking to NIWA for help to understand how their communities will be affected.
NIWA’s climate team – the country’s largest and most experienced – employs big data, extraordinary computing power and painstaking analysis to prepare climate-change projections for individual New Zealand regions. The team works closely with councils to ensure information is conveyed to stakeholders in clear and compelling ways.
First, the big picture
Dr Brett Mullan leads NIWA’s efforts to assess how climate change will affect the country as a whole – up to 150 years into the future.

He relies on supercomputing power – and lots of it – to run sophisticated programmes called General Circulation Models (GCMs). GCMs use mathematical equations to simulate the intricate physical and chemical interplay between atmosphere, oceans, land and ice that drives our climate.
“We can adjust, or ‘force’, GCM inputs, such as greenhouse gas volumes, to see how that interplay will change over time, and how our climate is likely to alter as a result,” Brett explains.
More than 40 GCMs, run on supercomputers around the world including NIWA’s new state-of-the-art Cray units, play their part in generating national climate change projections for New Zealand.
“But it’s not simply a case of flicking a switch,” Brett says. “There are significant challenges we need to address.”
Not all GCMs perform equally in the New Zealand setting, which is why so many are used together. When there’s general agreement between GCM outputs, researchers have greater confidence in their predictions. When there’s widespread disagreement, the task becomes considerably harder.
There’s also doubt about future rates of global greenhouse gas emissions. To account for this, the Intergovernmental Panel on Climate Change has established four future emissions scenarios, known as Representative Concentration Pathways (RCPs). Each RCP assumes a different rate of emissions into the future – ranging from a slowdown, to unabated growth.
Brett runs GCM simulations using each RCP, producing a range of possible climate-change outcomes for the nation at different dates in the future.
It’s complex, multidimensional science, which Brett has successfully translated into three exhaustive national climate-change projection reports for the Government since 2001.
Scaling down to regional level
Next, the team turns its attention to ‘downscaling’: tightening the focus of their projections to an individual region. Downscaling involves yet more computing power, and yet more complex mathematics.
First, Brett assesses which of the GCMs used to generate national projections will perform best at a smaller scale. For NIWA’s most recent round of regional analyses, six models were chosen using a process of statistical elimination.
Brett works with colleague Stephen Stuart to draw down the necessary regional data – terabytes worth – onto NIWA’s supercomputers. The data are used to establish ‘boundary conditions’: measurements such as sea-surface temperature and sea-ice extent, which provide a starting point for the models’ computations.
Then the number-crunching begins. All six models are run four times – once for each RCP – to mathematically scale their outputs down to the area of interest.
More analysis follows; more looking for trends and assessing the respective merits of each model’s outputs. There are ‘biases’ to sort out too – innate errors in the models that must be recognised and corrected before outputs are usable. Brett draws on the specialist skills of colleague Dr Abha Sood to help.
The resulting projections cover a range of climate variables, including temperature, rainfall, sea level and soil moisture, for the specified region.
Identifying local priorities
Meanwhile, Auckland-based climate scientists Petra Pearce and Dr Drew Lorrey are in deep discussion with the commissioning council to determine key areas of focus for the regional information package they’ll prepare.
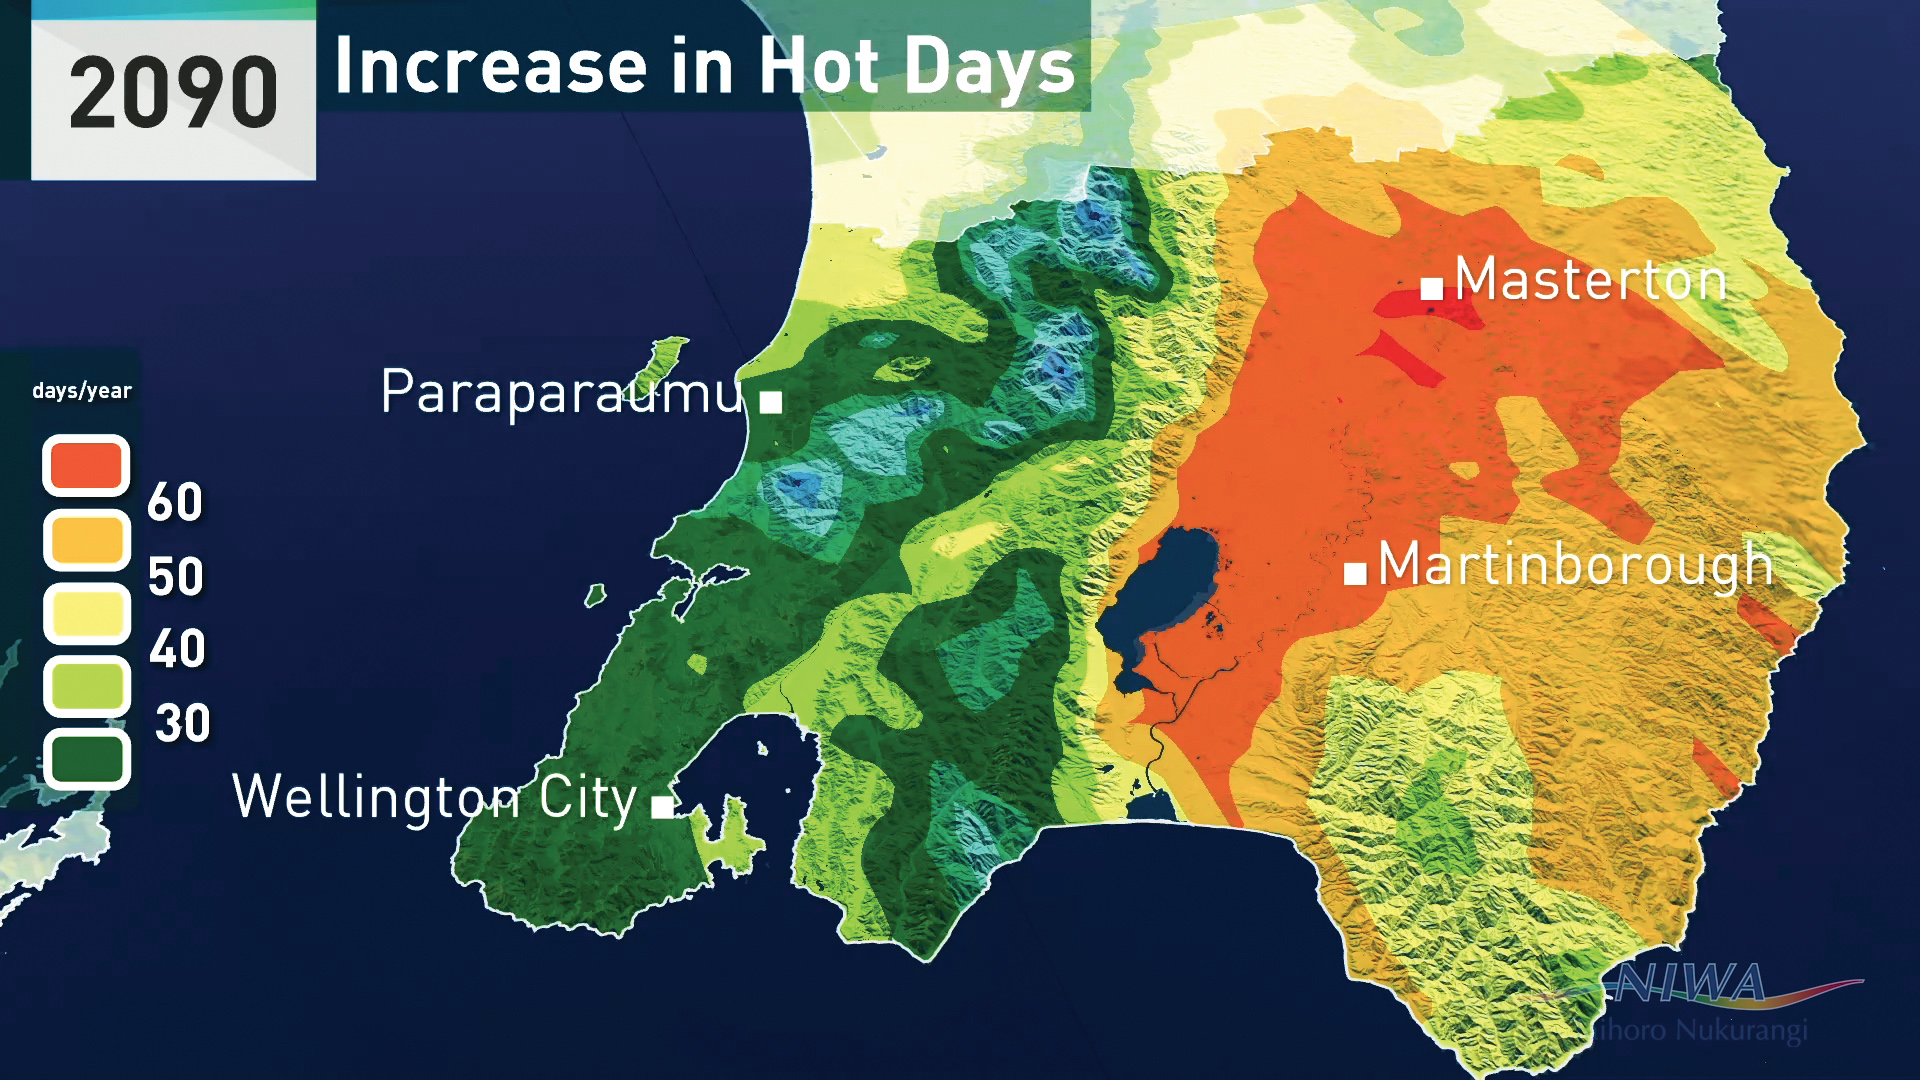
“A vital part of the job is to understand those priorities, to ensure we’re providing relevant information to the council,” Petra says. “For example, Northland is predominantly rural, so we focused our report on agricultural impacts. Greater Wellington is a mix of urban and rural environments, so that was reflected in our package for them.”
Making sense of it all
With regional priorities clearly understood, Petra then sets about assembling a comprehensive technical report.
“It’s not simply a case of pasting the modelled projections into a document and hitting send,” she says. “We look at the priority areas and assess how the projected changes will impact on them. That requires expert knowledge from right across NIWA.
“Sometimes up to a dozen NIWA scientists will provide commentary for the report – covering fields as diverse as coastal inundation, erosion, soil productivity and marine biodiversity.”
Petra and Drew also consider the information needs of stakeholders who don’t have a background in science. They work with council staff and NIWA data-visualisation specialist Nava Fedaeff, and videographer Stuart Mackay to prepare a summary report and video that present highlights of the region’s climate change story.
“Climate change affects everyone,” Petra says, “so it’s important that people from all backgrounds can make sense of it. For some, that’s reading a 300-page technical report. For others, it’s watching a four-minute video.”
Greater Wellington Regional Council Senior Science Coordinator Penny Fairbrother says the options provided by NIWA paid real dividends for the council’s outreach efforts.
“We were really impressed with the information package provided,” she says. “The video made to accompany the full technical report communicated the key messages clearly and simply.”