Traffic pollution measurements in Auckland since Level 4 restrictions were eased on Tuesday have shown levels soaring even higher than those before lockdown, NIWA air quality scientists say.
Analysis of nitrogen oxide levels, mostly caused by road traffic exhaust, shows levels in the past three days have far exceeded those leading up to March 26 when the country was effectively closed.
NIWA air quality scientist Dr Ian Longley says levels yesterday and today, recorded at morning rush hour, are partly due to very light winds which have amplified the effect.
“I was surprised to see the levels shoot up so high so quickly but it is likely they will return to pre-lockdown levels fairly quickly,” he said.
Today’s level at Takapuna was 250 mg/m which has not been as high since August last year.
Analysis of air monitoring sites at Takapuna, Henderson and Penrose told the same story while levels were lower in Queen St, possibly because fewer people were travelling into the centre of Auckland.
Nitrogen oxides have also returned to pre-lockdown levels in Christchurch but not as dramatically as Auckland.
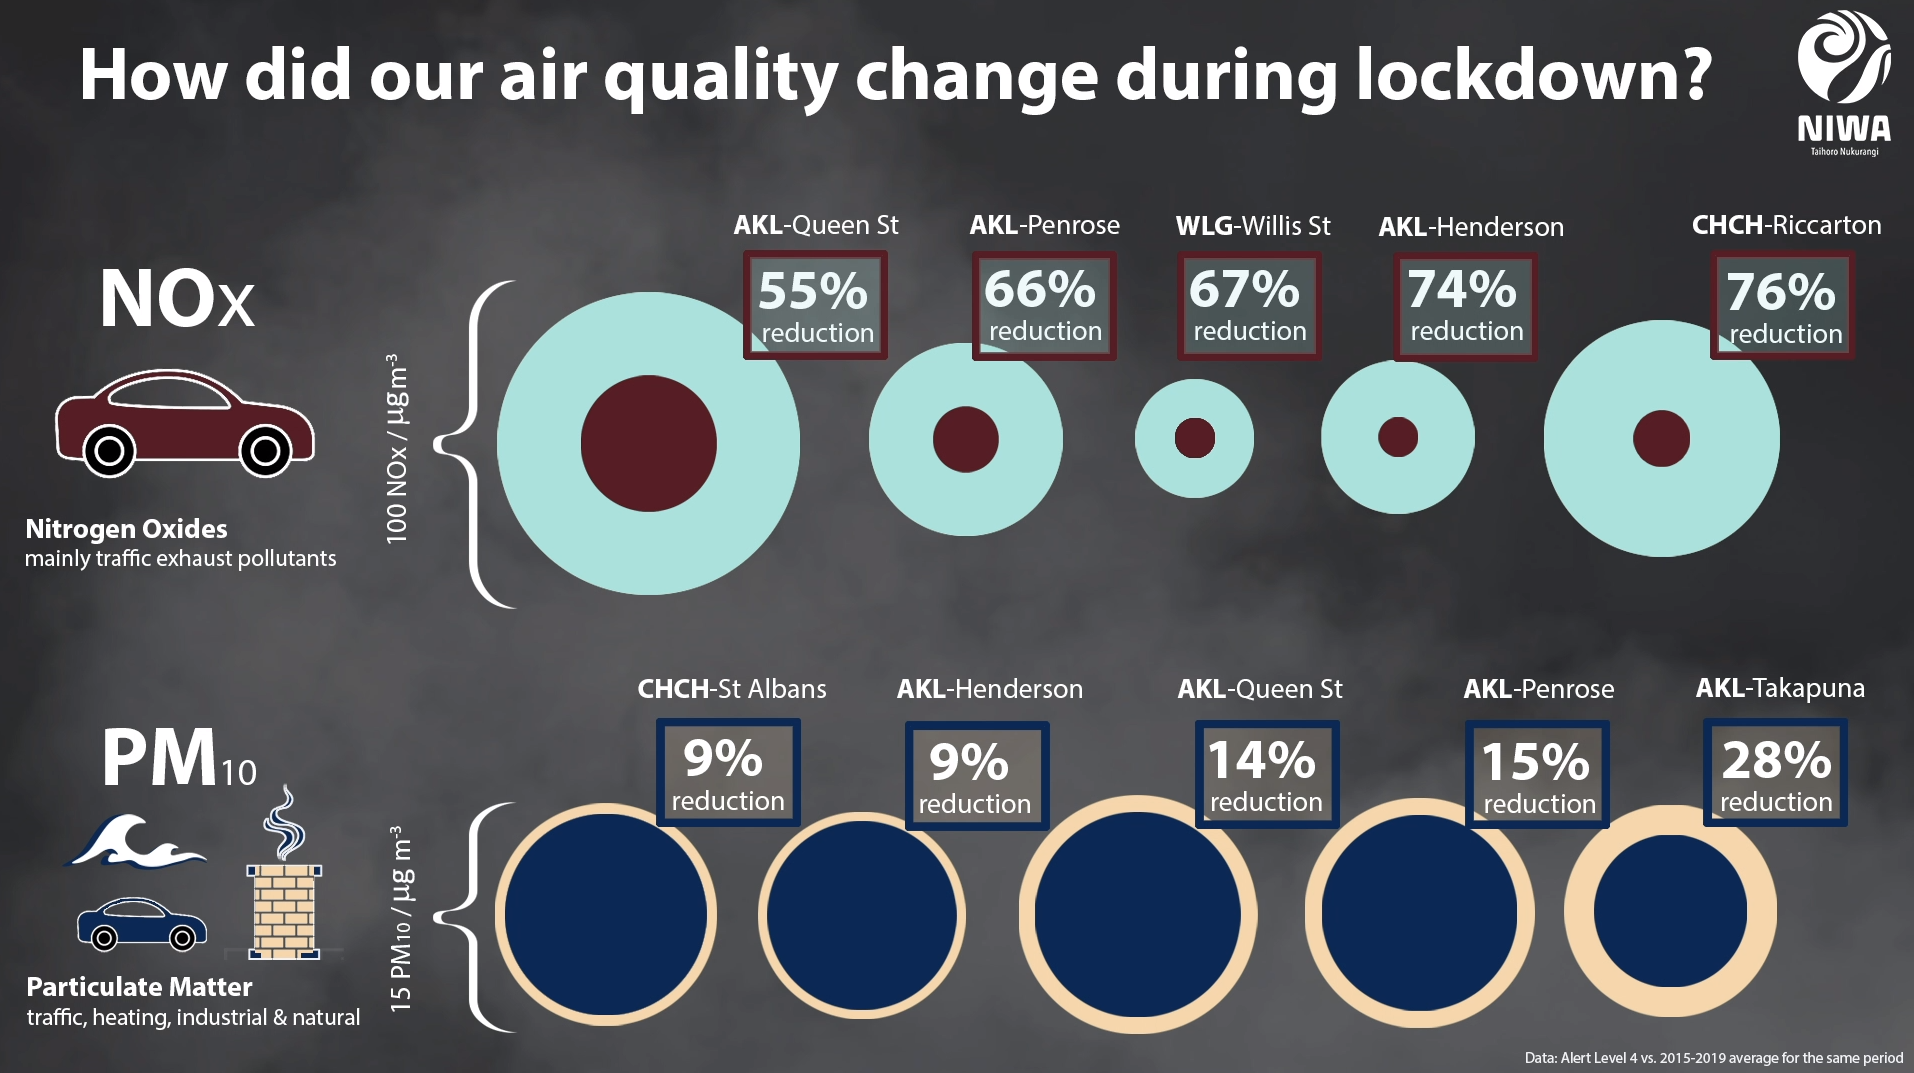
Over the five weeks Level 4 was in place concentrations of traffic pollution were down at sites across Auckland. This included by 54% at Queen St, 66% in Penrose, 73% in Takapuna and 74% in Henderson.
In Wellington reductions were 66% at Willis St, and in Christchurch 76% down in Riccarton.
Dr Longley calculated the average concentrations between March 26 and April 27 and compared the result to the average concentration over the same days from 2015-2019.
Dr Longley said that up until lockdown there was a consistent downward trend in nitrogen oxide levels related to improvements in vehicle technologies. However, if pollution levels revert to pre-lockdown levels and the same downward trend continued, it will take to the 2030s before air quality improves to that experienced during Level 4.
Meanwhile, Dr Longley has also researched how New Zealand’s air quality improvements compared to other cities across the globe. While comparisons are difficult because of variations in how air quality is measured, the European Environment Agency has published data showing reduction in NO2 of 24 % in Milan, 26 – 35 % in Rome, 55 % in Barcelona, 41% in Madrid and 51 % in Lisbon.
Other sources have reported 9 - 17 % drops in London (28 – 30 % in central London), 24 – 50 % across the UK, 20 – 56 % in Pakistan. These results put New Zealand’s cities (37 – 61 %) at the upper end of air quality improvements reported worldwide.
Other analysis has shown concentrations of dust, sea spray and smoke, known as particulate matter were only marginally down across Auckland, Dr Longley said.
This was most likely because many emissions sources, other than traffic, emit particles—in Auckland during autumn the significant source is sea salt left in air after sea spray evaporates.