A weekly update describing soil moisture patterns across the country to show where dry to extremely dry conditions are occurring or imminent. Regions experiencing significant soil moisture deficits are deemed “hotspots”. Persistent hotspot regions have the potential to develop into drought.
Facts: Soil Moisture
In the North Island, the past week was quite dry with most locations receiving less than 10 mm of rainfall, and many receiving 5 mm or less. Rainfall amounts were a bit higher in eastern Bay of Plenty, parts of Taranaki, and interior Manawatū-Whanganui, with isolated amounts as high as 30 mm. This generally resulted in a small to moderate soil moisture decrease across the North Island, with the largest decreases observed in Northland, Auckland, and northern Waikato. The driest soils across the North Island, when compared to normal for this time of the year, are found in western Northland and southern Manawatū-Whanganui, while the wettest soils for this time of the year are found in parts of Auckland and East Cape.
No hotspots are currently located in the North Island.
In the South Island, heavy rain again impacted the West Coast during the past week, with widespread amounts greater than 150 mm, and some areas in the central West Coast receiving more than 300 mm. Amounts of 50 mm or more were observed in Tasman and Fiordland, with up to 25 mm found in interior Otago and Southland. However, minimal amounts were observed in eastern Marlborough and Canterbury, with rainfall totals of 5 mm or less. This resulted in soil moisture increases in the West Coast, Otago, and Southland, with decreases along the east coast. The driest soils in the South Island, when compared to normal for this time of the year, are located in Nelson and central Canterbury, while the wettest soils for this time of the year are found in much of Otago and Southland.
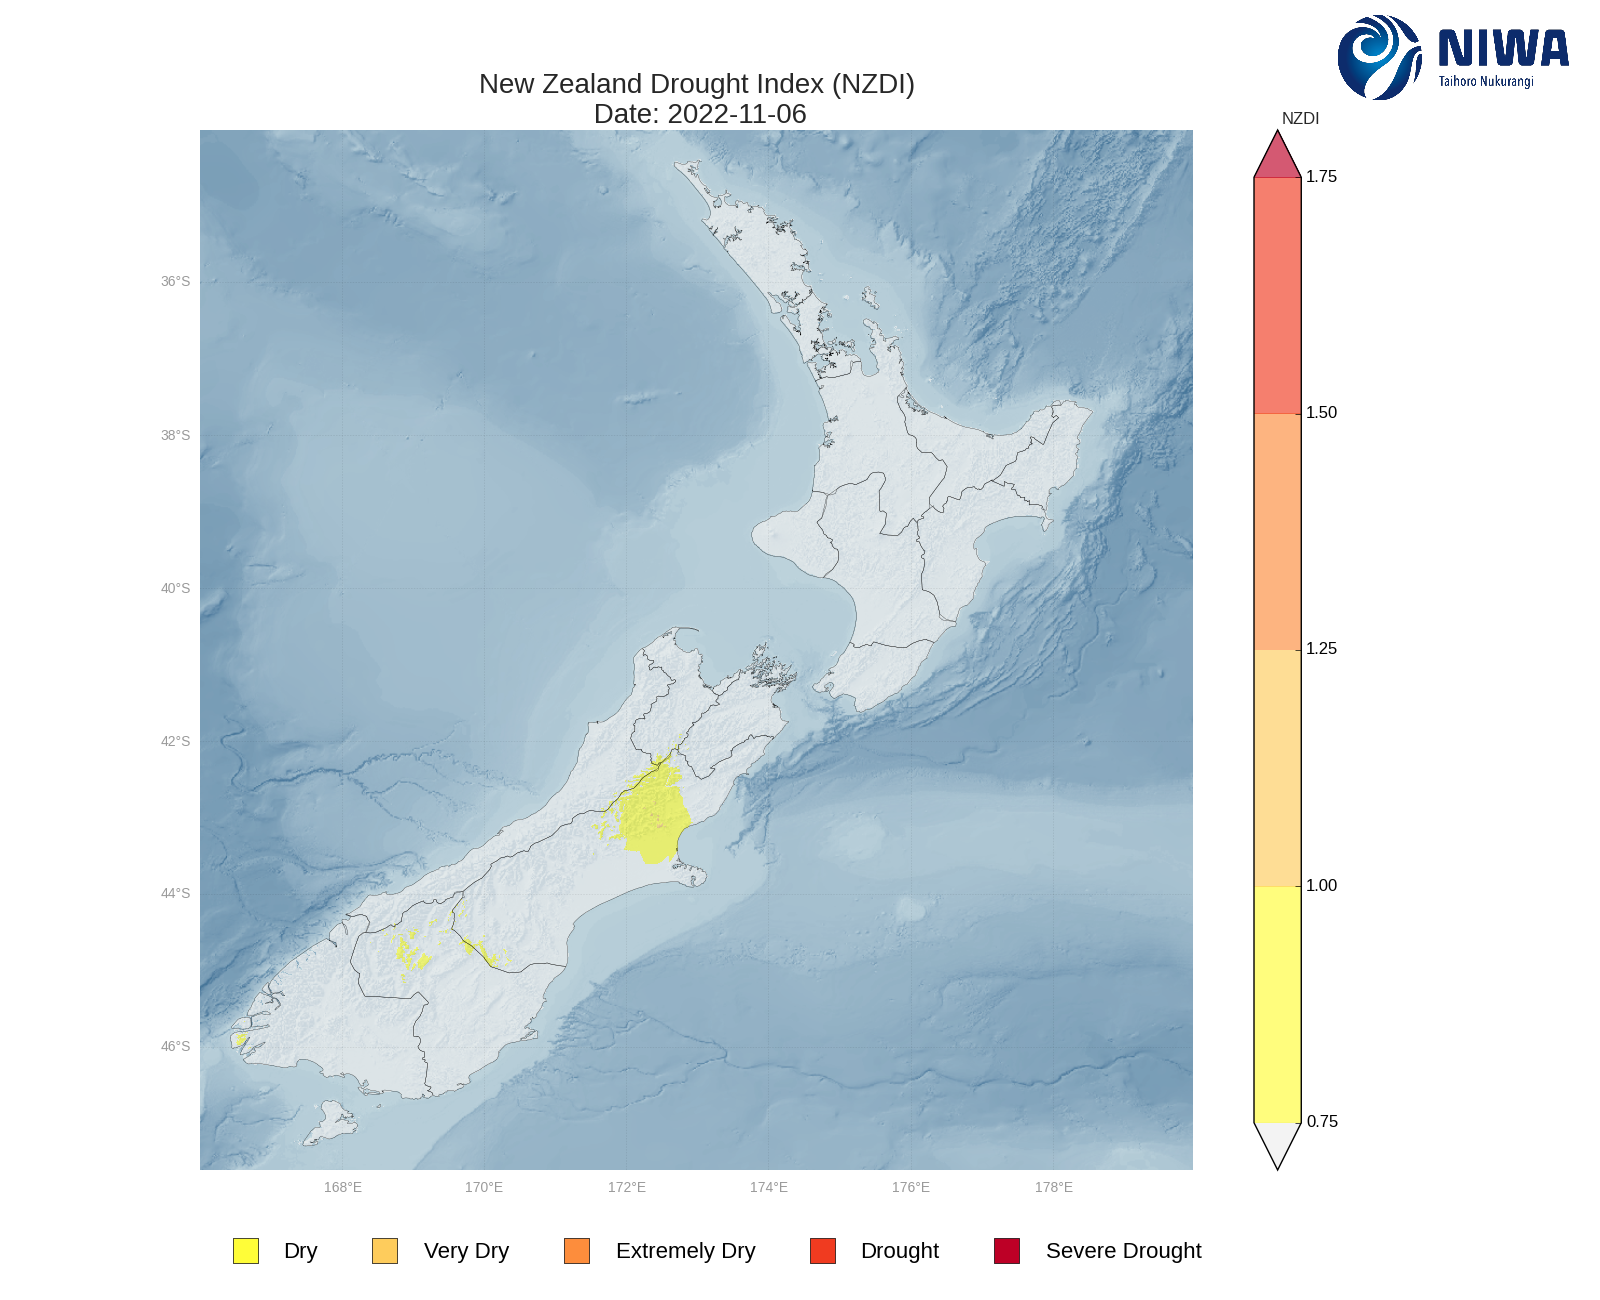
In the past week, new hotspots have formed in coastal Waimakariri, Selwyn, and Ashburton districts of central Canterbury. As of 6 November, the New Zealand Drought Index (NZDI) map below shows that dry conditions are located in a portion of central Canterbury and small parts of interior Otago and southwest Fiordland.
Outlook and Soil Moisture
In the North Island, periods of moderate rainfall will affect coastal areas from Northland to Gisborne from Tuesday to Wednesday morning (8-9 November), with areas farther south remaining dry. After mostly dry weather on Thursday, heavy rain is expected to impact the upper North Island on Friday and Friday night (11 November). Regions such as Northland, Auckland, and the Coromandel may see at least localised flooding due to this heavy rain. On Friday night and Saturday morning, lighter rain will move across the lower North Island also. Saturday and Sunday may feature scattered afternoon showers, followed by generally dry weather early next week. Weekly rainfall totals could reach or exceed 75 mm in the upper North Island, with pockets of 100 mm totals possible. More moderate totals of 25-40 mm are expected in central areas, with generally less than 25 mm in the lower North Island.
Due to the expected rainfall in the next week, substantial soil moisture increases are likely in the upper North Island, with at least some increases possible in central areas. Farther south, little change or small decreases may occur.
In the South Island, generally dry weather is expected through Friday (11 November), although a handful of light showers may affect Canterbury on Wednesday and Thursday. Saturday will see showers affecting the top and west of the South Island, with other areas generally remaining dry. After isolated showers on Sunday (13 November), dry weather is likely to return on Monday before a front potentially reaches Fiordland on Tuesday (15 November). Weekly rainfall totals are expected to generally be light across the South Island. The top of the island and the West Coast may see totals in the 10-25 mm range, with only minimal rain likely in Canterbury, Otago, and Southland.
Due to the expected rainfall in the next week, soil moisture levels may decrease a small to moderate amount in the West Coast and upper South Island, with more substantial decreases likely in Canterbury, Otago, and Southland. The existing hotspot in central Canterbury is likely to strengthen and expand in the next week, while a new hotspot may form in northern Otago.
Background:
Hotspot Watch: a weekly advisory service for New Zealand media. It provides soil moisture and precipitation measurements around the country to help assess whether extremely dry conditions are imminent.
Soil moisture deficit: the amount of water needed to bring the soil moisture content back to field capacity, which is the maximum amount of water the soil can hold.
Soil moisture anomaly: the difference between the historical normal soil moisture deficit (or surplus) for a given time of year and actual soil moisture deficits.
Definitions: “Extremely” and “severely” dry soils are based on a combination of the current soil moisture status and the difference from normal soil moisture (see soil moisture maps at https://www.niwa.co.nz/climate/nz-drought-monitor/droughtindicatormaps)
Hotspot: A hotspot is declared if soils are "severely drier than normal" which occurs when Soil Moisture Deficit (SMD) is less than -110 mm AND the Soil Moisture Anomaly is less than -20 mm.
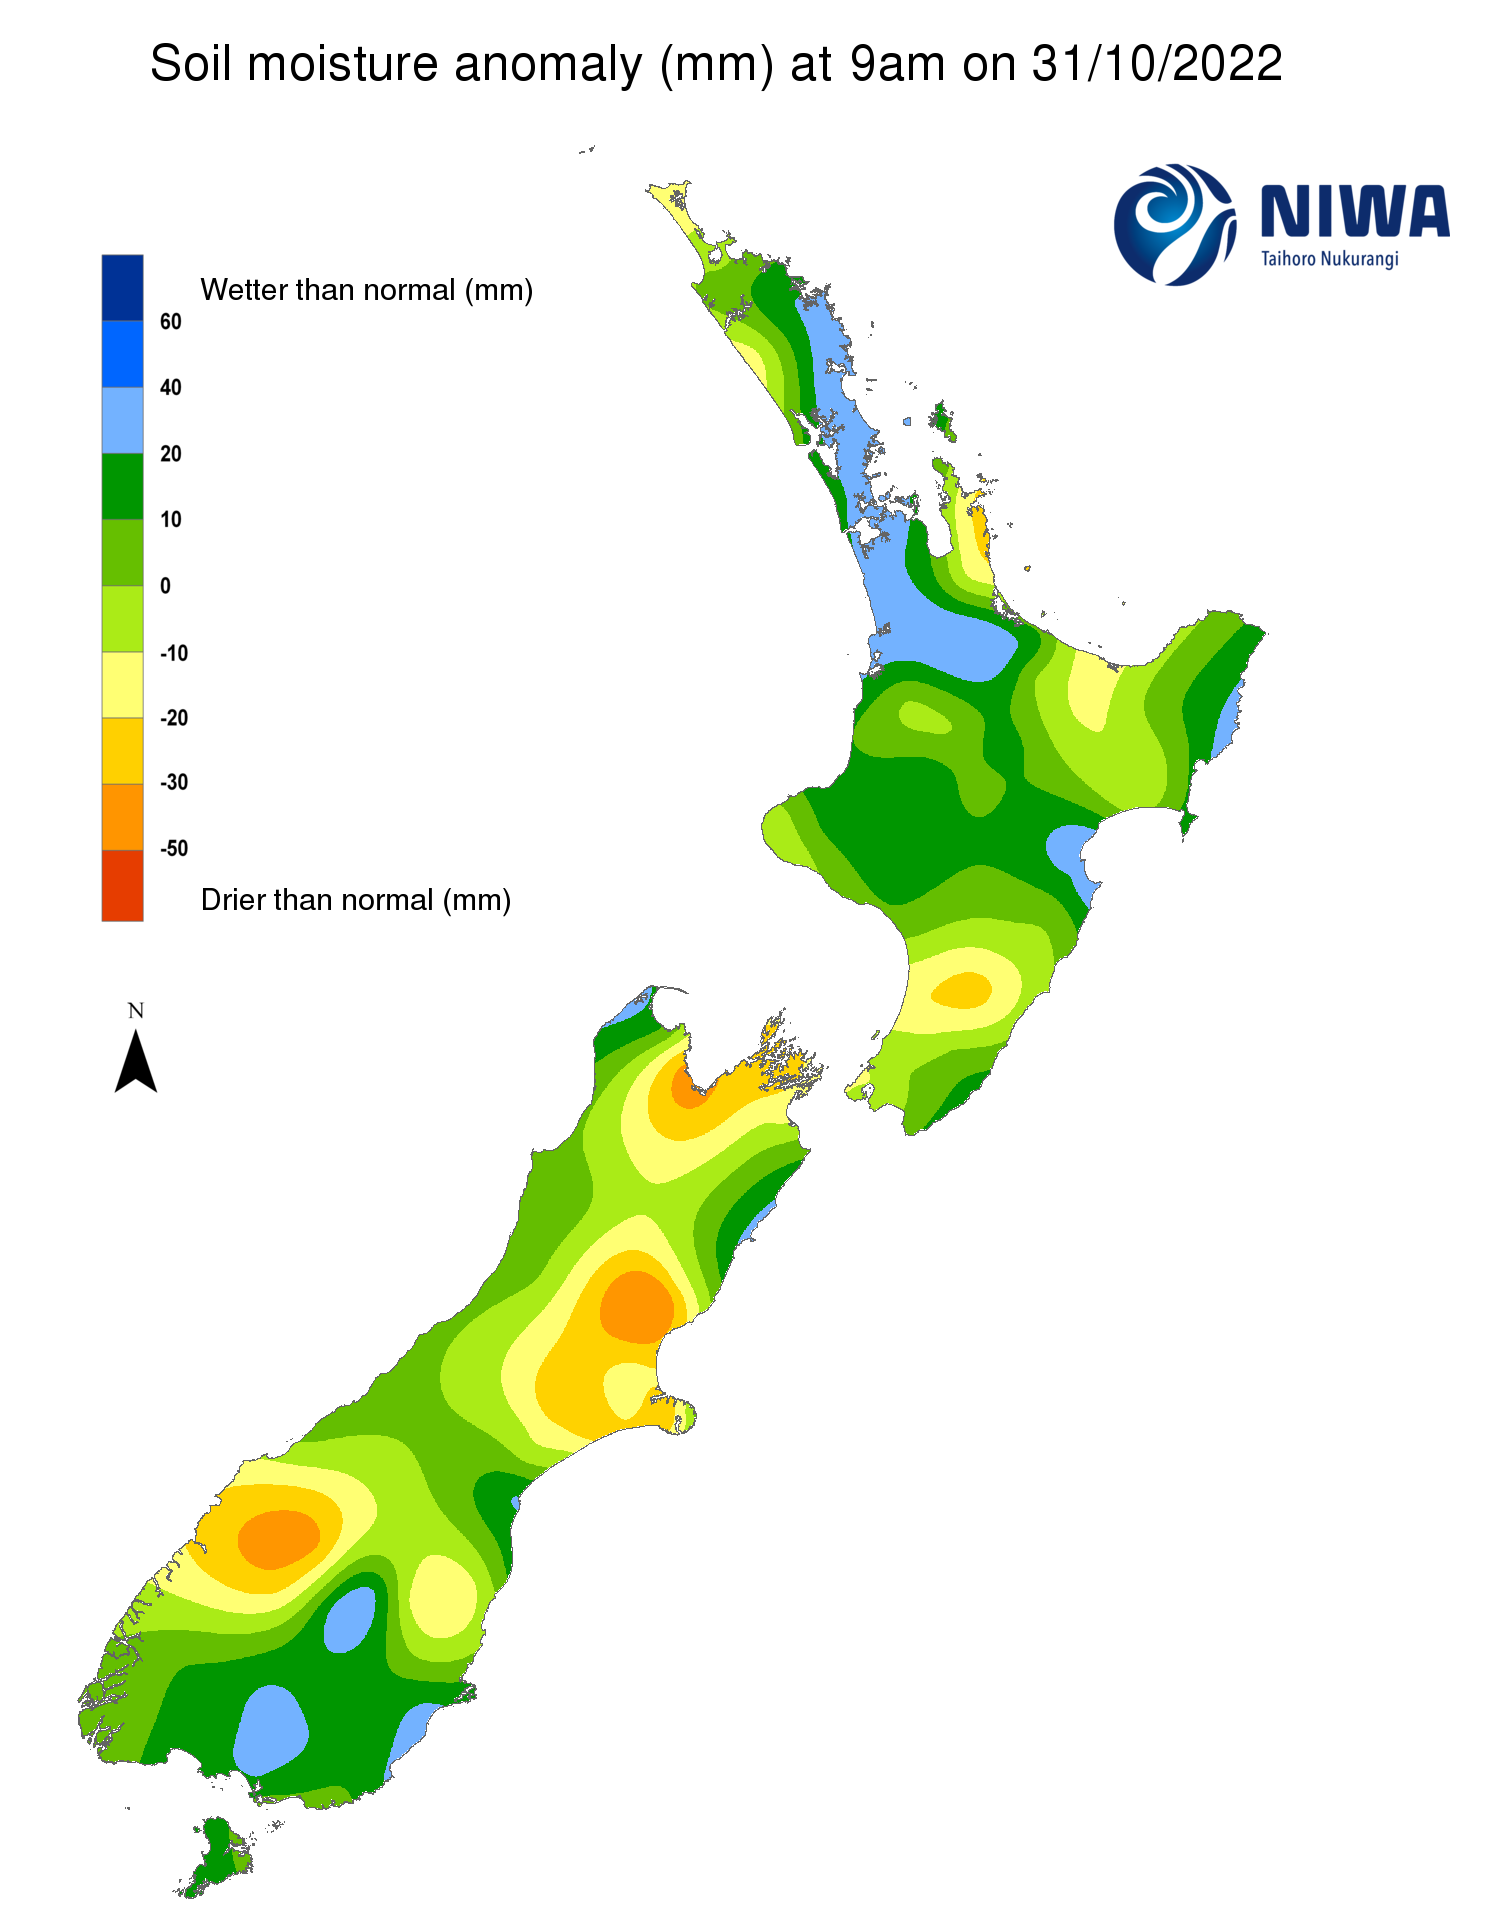
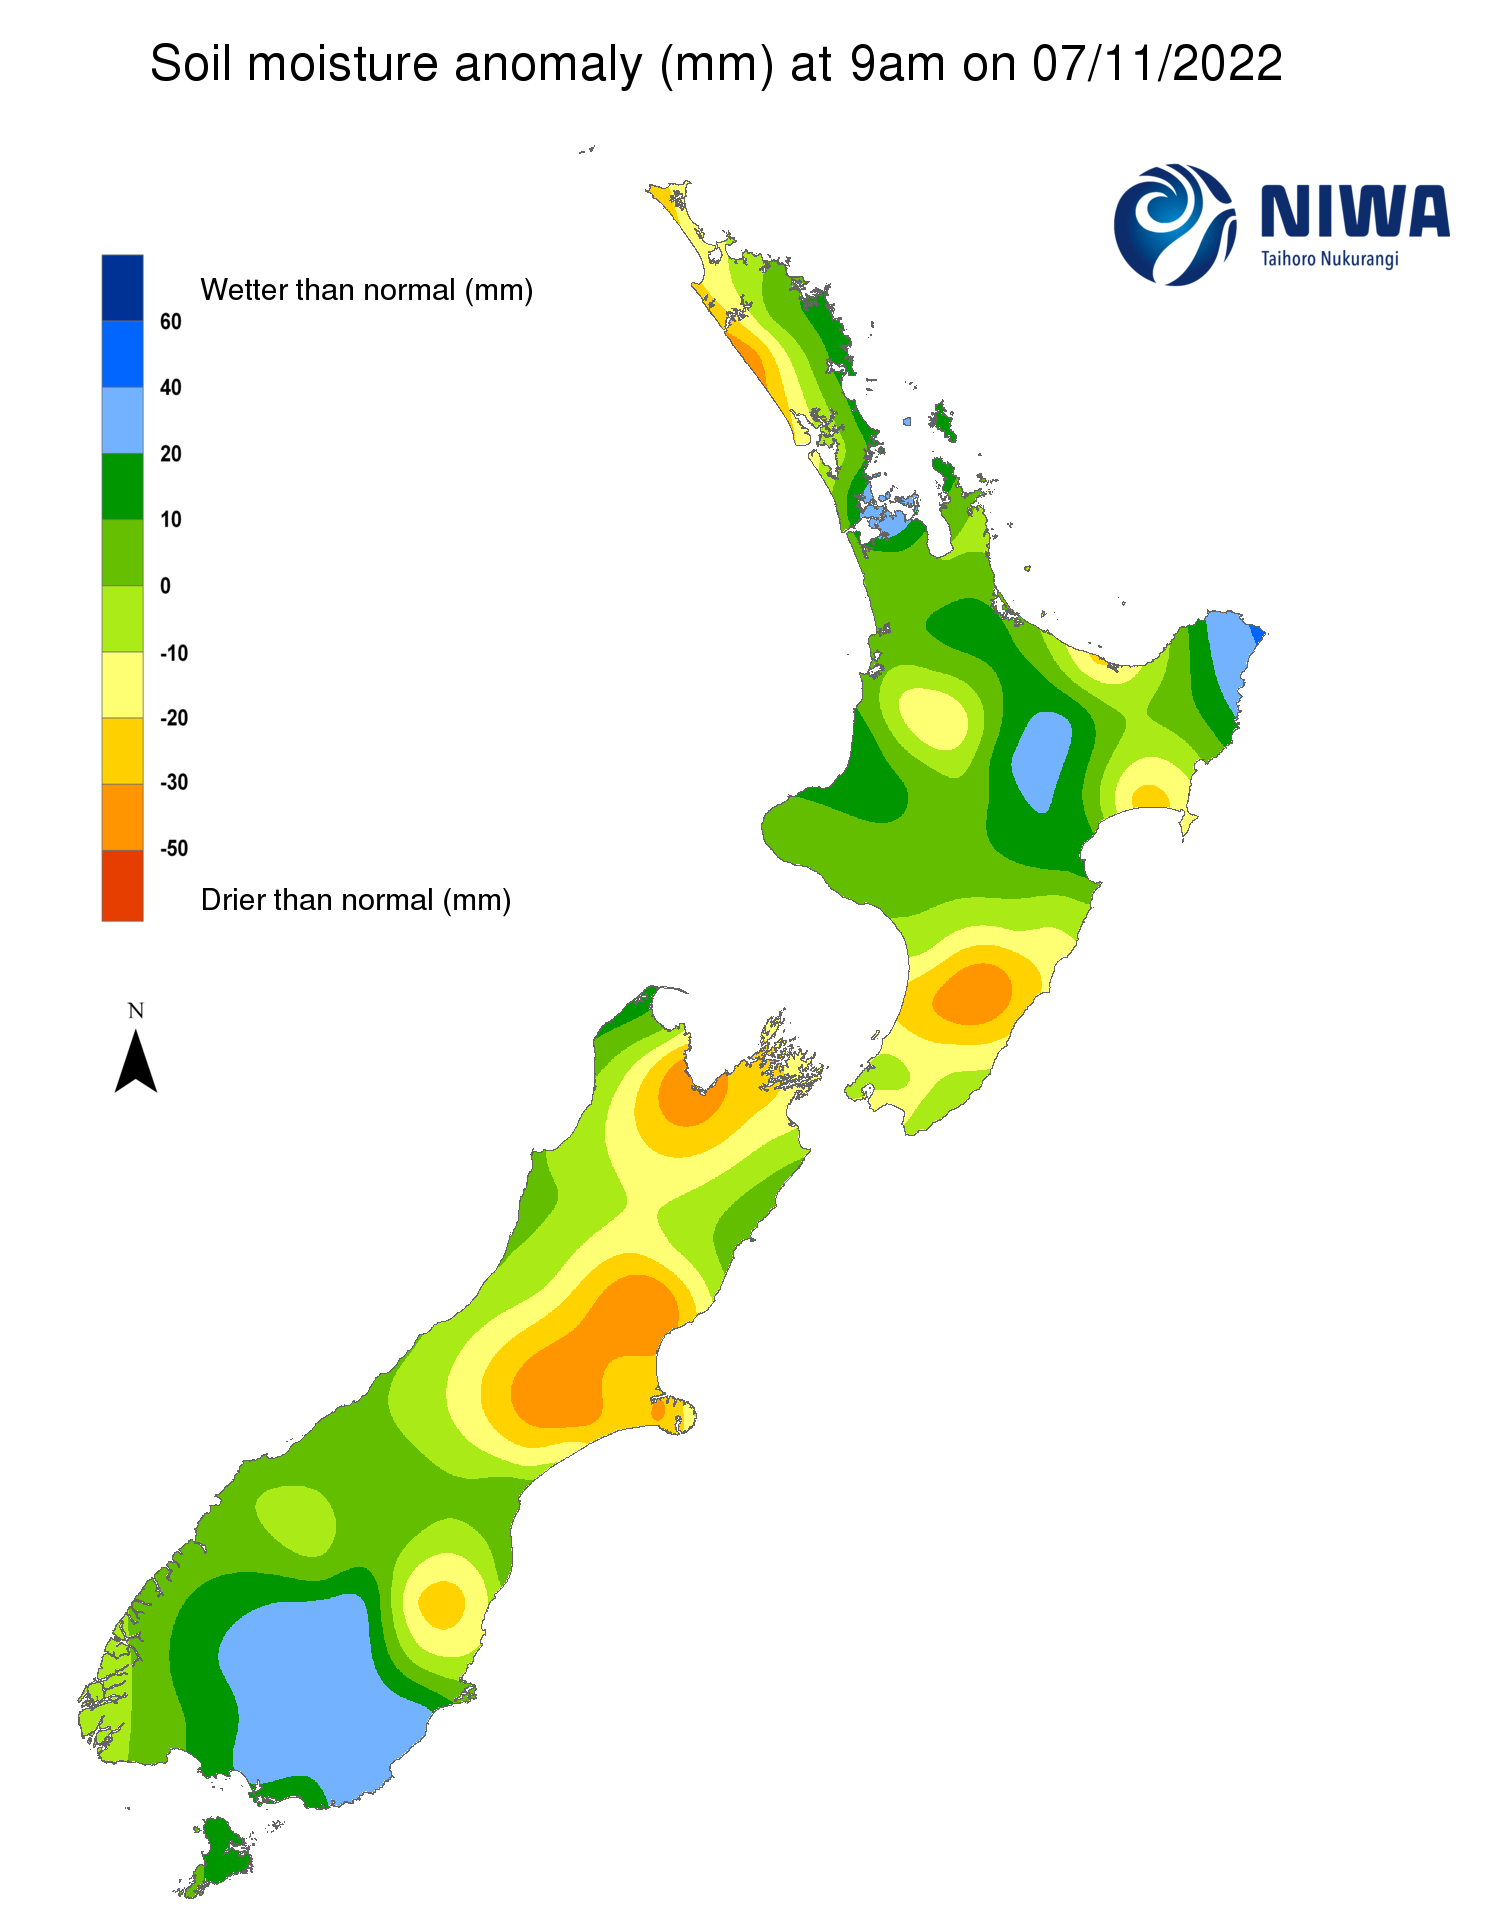
Pictured above: Soil Moisture Anomaly Maps, relative to this time of year. The maps show soil moisture anomaly for the past two weeks.
New Zealand Drought Index (NZDI)
As of 6 November, the New Zealand Drought Index (NZDI) map below shows that dry conditions are located in a portion of central Canterbury and small parts of interior Otago and southwest Fiordland.
Please note: some hotspots in the text above may not correspond with the NZDI map. This difference exists because the NZDI uses additional dryness indices, including one which integrates the rainfall deficit over the past 60 days. Changes are therefore slower to appear in the NZDI compared to soil moisture anomaly maps that are instantaneously updated.