El Niño – Southern Oscillation (ENSO) neutral conditions are most likely (54% chance) over the next three months period (June – August 2016) but a transition to La Niña is possible (43% chance).
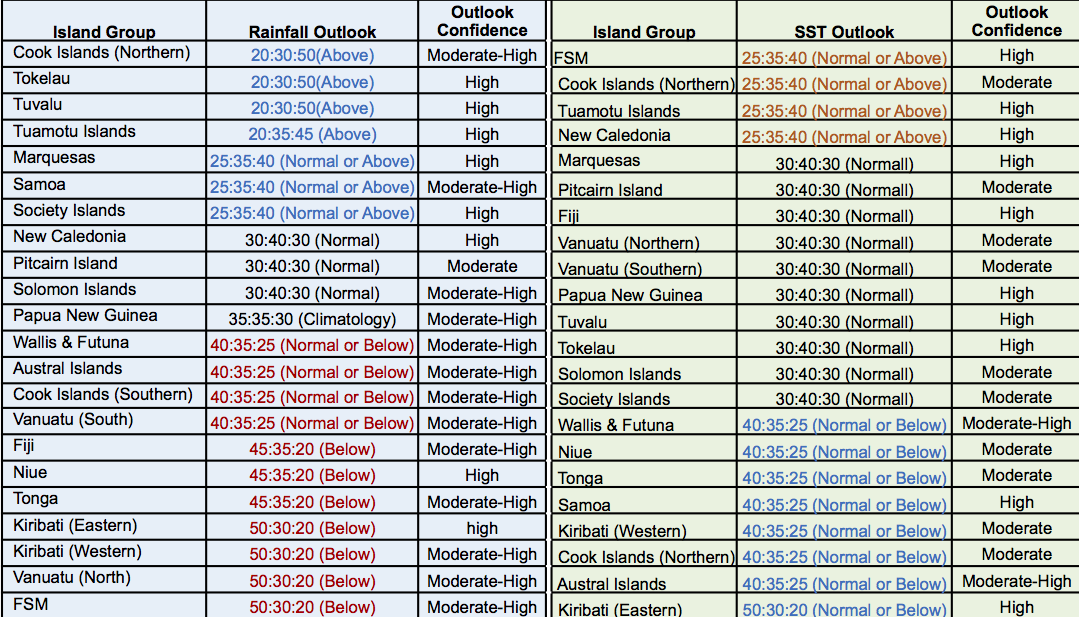
The rainfall outlook partly reflects La Niña impacts over the next three months, with the eastern equatorial Pacific at risk of experiencing below normal rainfall. Below normal rainfall is forecast for Fiji, Niue, Tonga, eastern Kiribati, western Kiribati, northern Vanuatu and the Federated States of Micronesia. Normal or below normal rainfall is forecast for Wallis & Futuna, the Austral Islands, the southern Cook Islands and southern Vanuatu. Normal or above normal rainfall is forecast for the Marquesas, Samoa and the Society Islands. Above normal rainfall is forecast for the northern Cook Islands, Tokelau, Tuvalu and the Tuamotu archipelago. Near normal rainfall is forecast for New Caledonia, Pitcairn Island and the Solomon Islands. No clear guidance is available this month for Papua New Guinea.
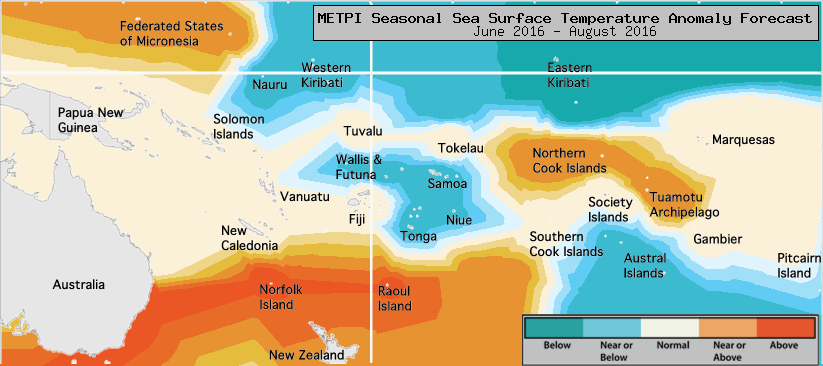
The first signs of a probable La Niña event developing later in 2016 have started to appear, with cooler than normal surface ocean waters in the eastern Equatorial Pacific. The dynamical models agree to forecast a slow intensification and expansion of this area of cooler than normal ocean waters. The warm ocean waters east of Australia and around New Zealand are also forecast to persist. Normal or above normal SSTs are forecast for the Federated States of Micronesia, the northern Cook Islands, the Tuamotu archipelago and New Caledonia. Below normal SSTs are forecast for eastern Kiribati. Normal or below normal SSTs are forecast for Wallis and Futuna, Niue, Tonga, Samoa, western Kiribati, the northern Cook Islands and the Austral Islands. The average region-wide hit rate for rainfall forecasts issued for the June – August season is about 61%, 2% below the average for all months combined. The confidence for the SST forecasts is moderate to high.
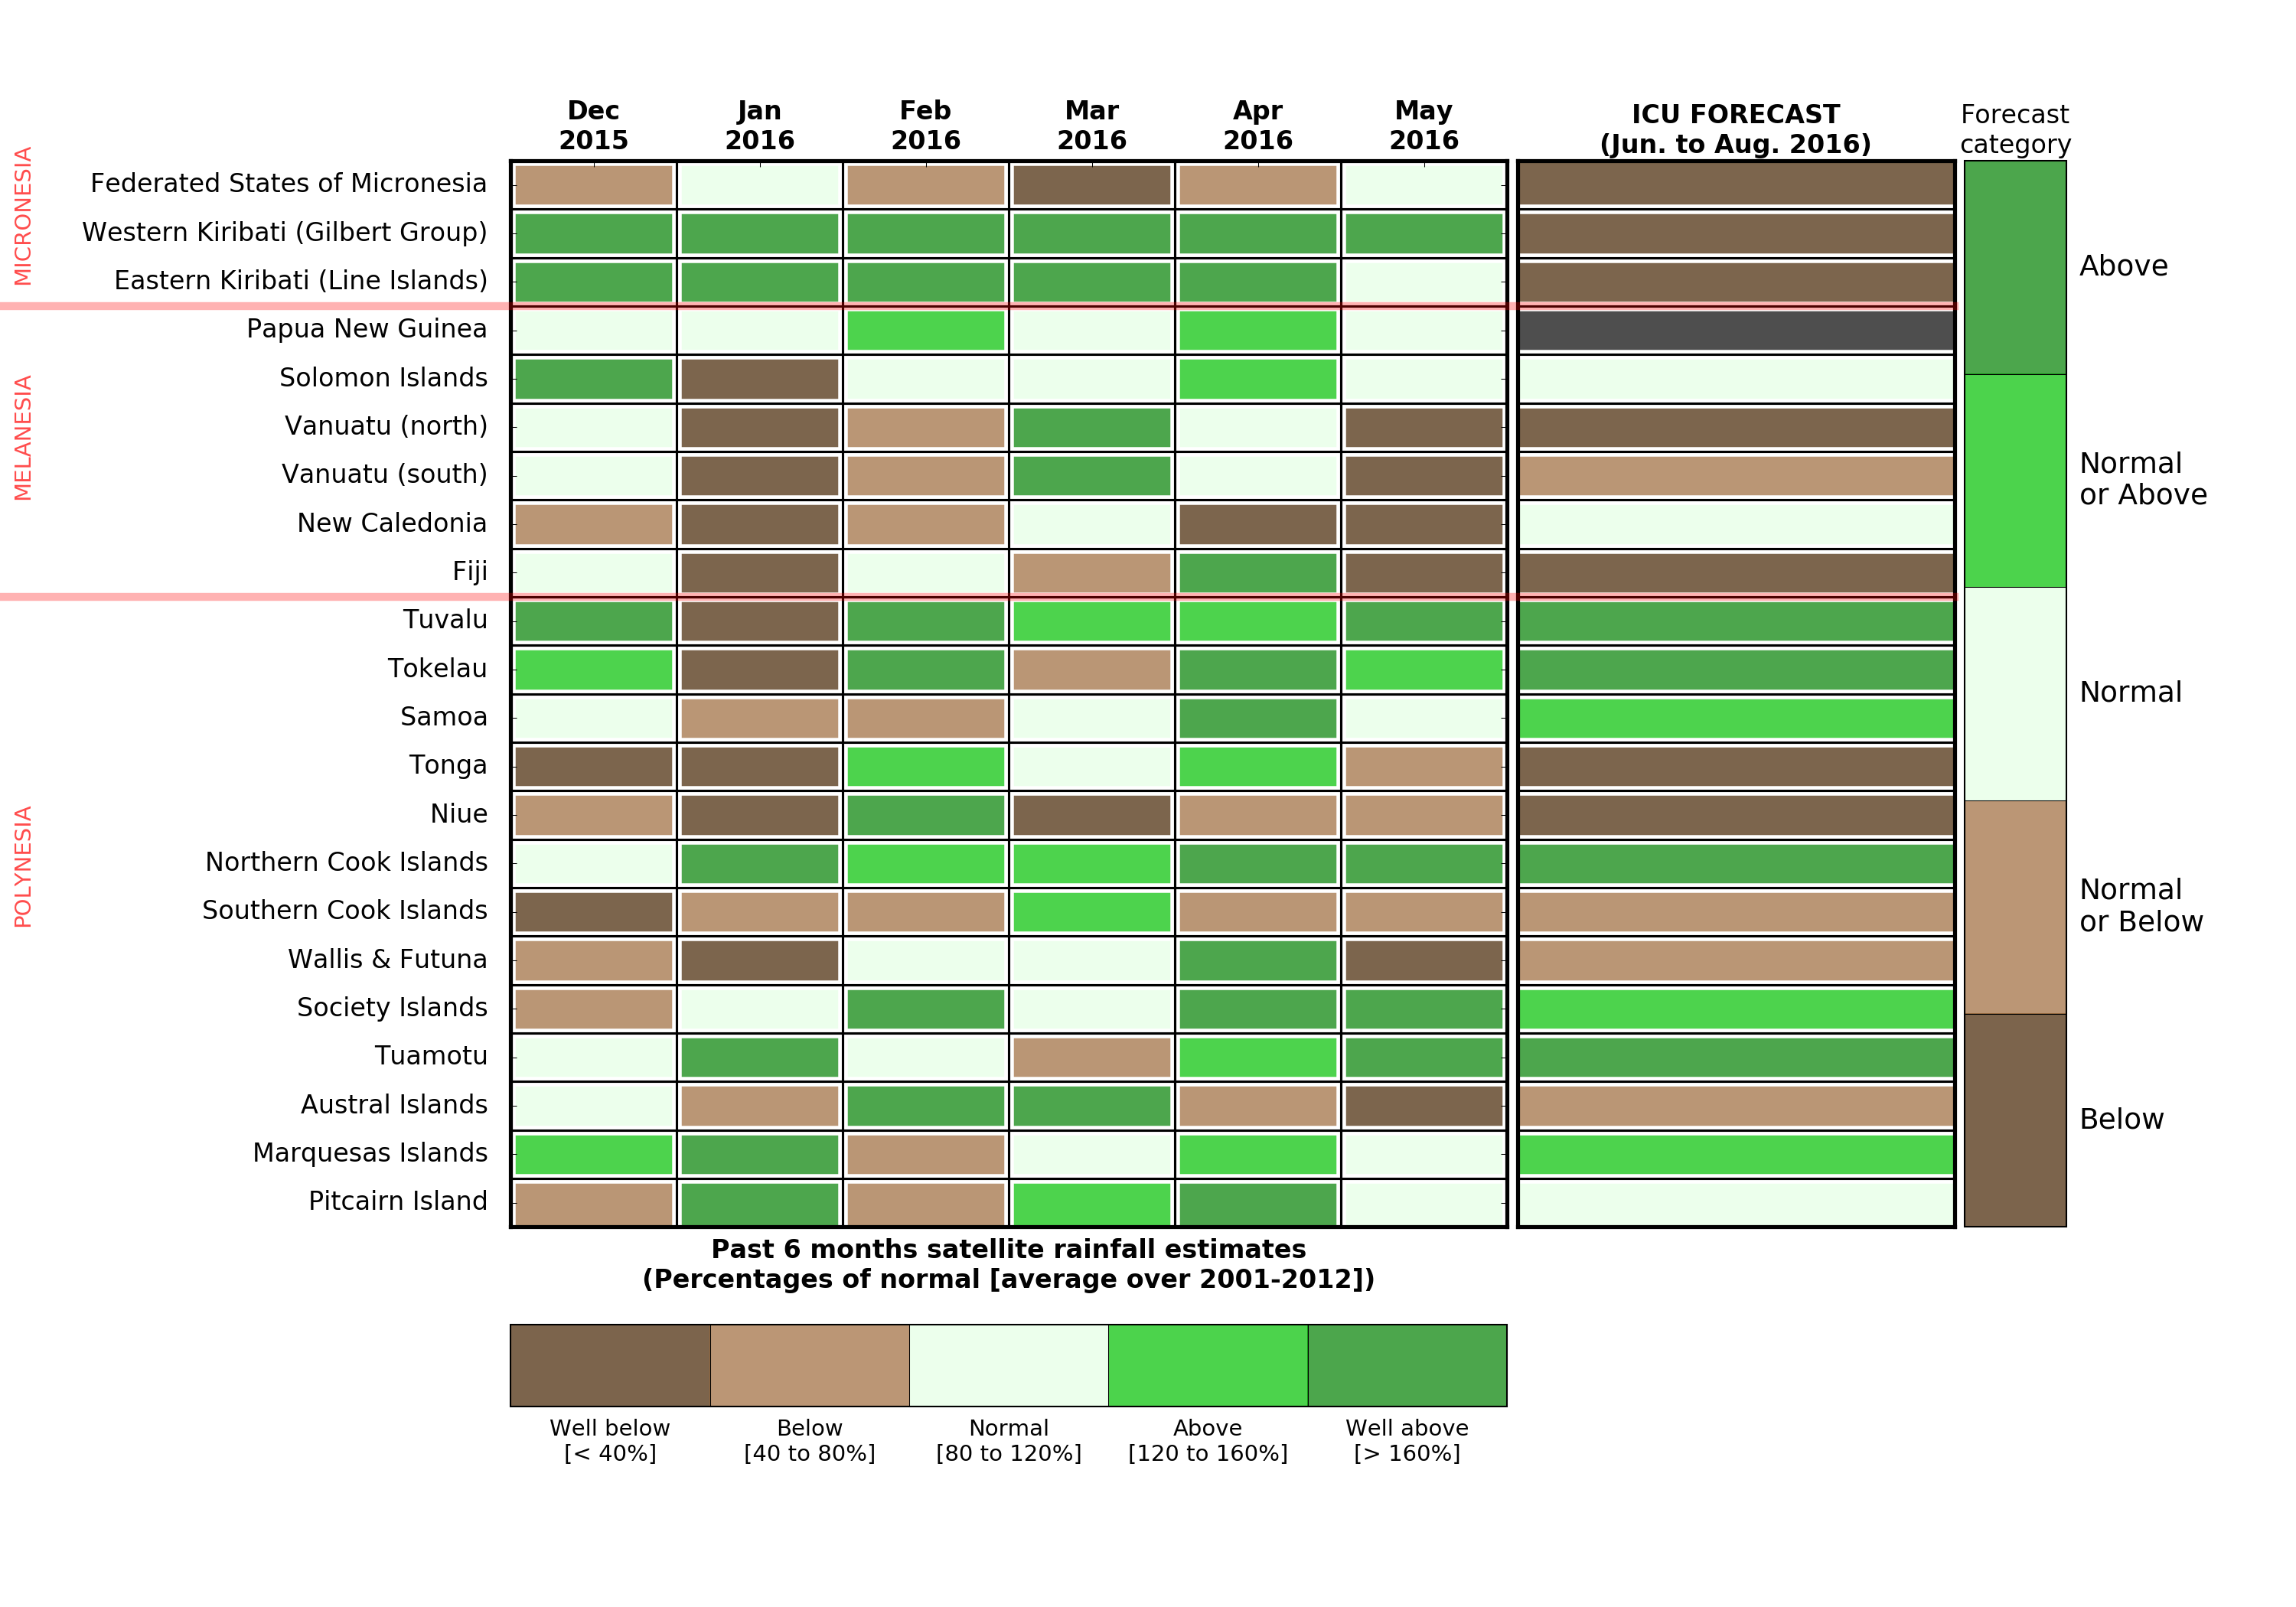
The figure on the bottom right presents the last six months rainfall anomalies for each Island group alongside the latest ICU rainfall forecast for the June - August 2016 period.
The past 6 months rainfall anomalies are based on the near-real-time TRMM (Tropical Rainfall Measurement Mission) merged satellite product available from http://trmm.gsfc.nasa.gov. The data has been downloaded and available on the link below:
For each Island group, the monthly value is derived from the average of all grid-points (or "pixels") in the TRMM Dataset that intersect a coastline, to ensure that the values correspond as closely as possible to rainfall on land, and excluding rainfall falling on ocean surfaces.
The climatology used has been established over the 2001 – 2012 period. The categories ("Well-below", "Below", etc) are determined according to the percentage of the normal rainfall for that month. The thresholds are indicated in the colorbar at the bottom: to give an example, "Well-below" normal rainfall means the rainfall for that month was under 40 % of the normal rainfall, "Below" normal rainfall means that between 40 and 80 % of normal rainfall was received, etc.
IMPORTANT NOTE:
Please note that, while we use the same color-scheme for the past rainfall anomalies and the ICU forecast, the type of information presented is different. In the case of the past 6 months, actual rainfall has been estimated by satellite, and the categories are well-defined by monthly estimated rainfall compared to the long-term mean. The ICU forecast, on the other hand, is probabilistic: it indicates the likelihood (percentage chance) of rainfall being at, above, or below normal for the season as a whole. When the percentage chances in two categories are close to each other, we indicate both categories: for example if the forecast is for 35 % chance of receiving below rainfall, and 40 % chance of normal rainfall, the outcome is "Normal or below".