An interactive webtool to support barrier prioritisation and fish passage environmental reporting.

Click the above button to view tool in web browser
The Barrier Assessment and Reporting Tool (BART) has been created to help river managers and asset owners understand connectivity in different catchments, and prioritise barriers within catchments for remediation. BART also incorporates an environmental reporting tool that will simplify the process of reporting on barrier identification, assessment, and remediation.
BART uses data from the Fish Passage Assessment Tool to calculate the Dendritic Connectivity Index (DCI), a measure of river fragmentation, for every catchment in the country. A DCI score of zero represents a completely fragmented catchment, whereas, a DCI score of 100 represents a fully connected catchment (i.e., no fish barriers are present). The DCI is subsequently used to prioritise barriers based on optimising the greatest gains in connectivity for each catchment.
The BART prioritisation framework was designed to be flexible and consistent with other NPS-FM policy imperatives. It is a hierarchical framework that prioritises structures within a catchment based on optimising gains in connectivity but allows prioritisation between catchments based on overall catchment connectivity (as measured by the DCI) and additional values.
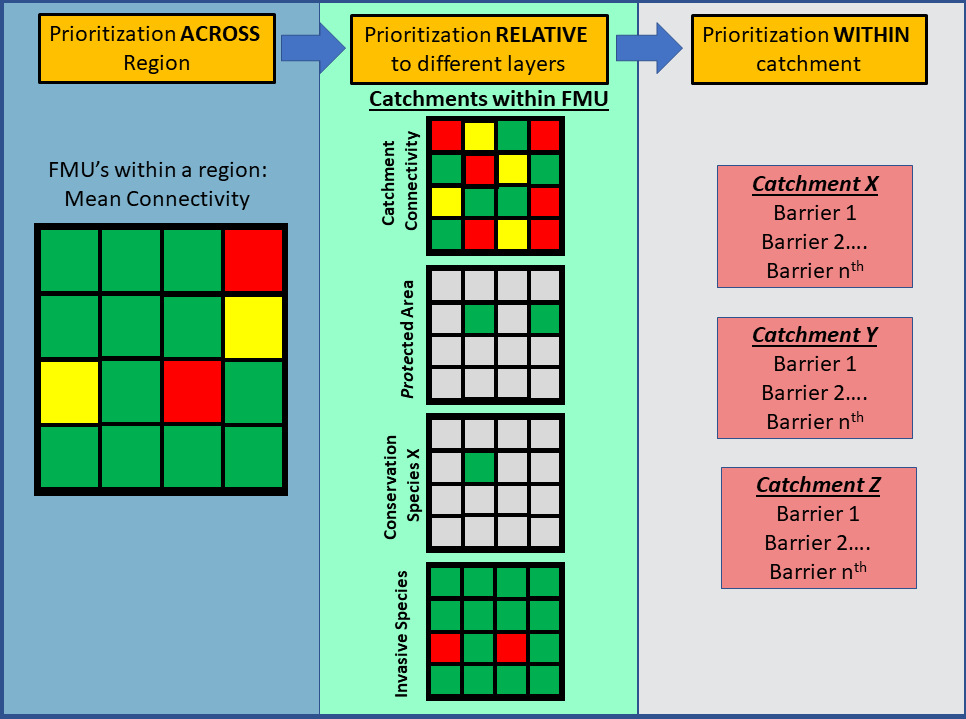
The prioritisation scheme (Figure 1) can 1) help to identify where to focus connectivity restoration actions across catchments (left panel Figure 1), 2) incorporate additional information and criteria based on Table 5.1 of the Fish Passage Guidelines (e.g., invasive species, species richness, and threatened species; middle panel Figure 1), and 3) at the catchment scale, identify barriers that maximise improvements in the DCI score until the catchment reaches it maximum connectivity capacity (right panel Figure 1).
The BART is currently fully implemented for the Northland, Waikato, Hawke’s Bay, Taranaki, and West Coast regions. If you are interested in implementing BART for your region, please email [email protected].
Licensing & using data
All data unless specifically stated is licensed under a Creative Commons Attribution 3.0 New Zealand License and must be attributed back to its original creator.
Acknowledgements
This webtool was developed by Dr Shad Mahlum, Dr Cindy Baker, and Dr Paul Franklin, with funding from NZ Ministry for the Environment.