Written by Ben Noll, NIWA Meteorologist/Forecaster
Download a shorter version of this lesson in PowerPoint or as a PDF or continue below to see the lesson in full.
The summer of 2019-20 was the driest on record for much of Auckland. Summer 2017-18 was the hottest on record for most of New Zealand. Autumn 2017 was one of the wettest, but spring 2014 was just average.
Have you ever wondered what makes the climate during one season more extreme than another? Such as why sometimes it rains, and rains and rains some more and other times it’s non-stop sunshine and beach weather? We’ll explore the reasons behind it in this lesson.
Climate drivers
As we’ve learnt earlier, climate represents the weather trends and patterns that are experienced in a location over a long period of time, such as months to years.
Global climate drivers influence weather patterns that occur over months and seasons. There are several important climate drivers (both natural and manmade) that give us clues to what the general weather pattern might look like.
You can think of climate drivers like pie. Each driver gets a piece of the pie, but depending on the season, a certain climate driver may get a bigger piece of the pie than other drivers. That driver would then have a bigger influence on the weather that occurs during that season. Forecasters must determine the size of the slice (of the “climate pie”) that each climate driver will have in order to have a chance at accurately predicting future climate conditions.
Now we’ll learn about the different slices of the climate driver pie. It all starts with that big ball of fire 150 million kilometres away from Earth: the Sun!
Climate driver one: the sun
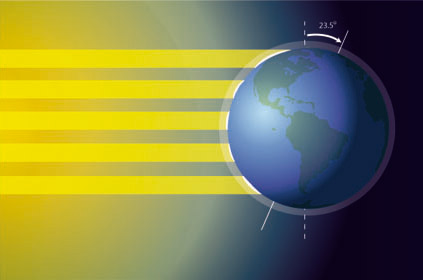
The sun provides the primary source of energy driving Earth’s climate system. The sun’s energy, called solar radiation, isn’t equally distributed across the globe because of Earth’s spherical shape. This “unequal helping” of solar radiation across our planet is effectively what causes weather and climate.
Differences in solar radiation lead to differences in temperature and differences in temperature ultimately lead to stormy weather – storms are Mother Nature’s way of trying to minimise temperature differences.
The part of the world where the sun shines the most are the tropics. Because of this, the ocean in the tropics is warmer than anywhere else in the world – sometimes over 30 degrees!
Climate driver two: El Niño Southern Oscillation
El Niño Southern Oscillation (ENSO) is a climate pattern that influences rainfall, temperature, and wind patterns around the world. ENSO has three phases: El Niño, La Niña, and neutral. El Niño and La Niña events occur, on average, every few years and last up to around a year or two.
El Niño
During an El Niño event, ocean water from the west coast of South America to the central tropical Pacific gets a lot warmer than usual because of changes in the wind. This unusually warm ocean water puts more energy into the atmosphere to form clouds, rainfall and thunderstorms – ultimately influencing weather patterns around the world.
During El Niño, New Zealand tends to experience stronger, more frequent winds from the west in summer, which can encourage dryness in eastern areas like Hawke's Bay and Canterbury and more rain in the west, like in the West Coast. In winter, the wind tends to blow more from the south, causing colder temperatures across the country.
La Niña
During a La Niña event, ocean water off the coast of South America to the central tropical Pacific gets cooler than usual. This cooling occurs because of strong winds that churn cooler, deeper sea water up to the ocean’s surface.
For New Zealand, north-easterly winds become more common during La Niña events, bringing moist, rainy conditions to north-eastern areas of the North Island and less rainfall to the lower and western South Island.
Neutral
Neutral means we are not experiencing El Niño or La Niña. It doesn’t mean that the tropical Pacific isn’t influencing New Zealand’s weather, it just usually isn’t a strong driver.
Climate driver three: Madden-Julian Oscillation
The Madden-Julian Oscillation (MJO) is an eastward moving zone of cloud and rain that circles the tropical areas of the globe. It is the biggest driver of changing weather in the tropics.
The MJO and its rain and thunderstorms are more likely to develop over an area that is experiencing warmer than usual ocean temperatures and less likely to affect an area with cooler than usual ocean temperatures.
Forecasters can track the MJO as it moves across the tropics. Its location in the tropics can help forecasters determine the most likely weather patterns in New Zealand and other parts of the world over the next 2 to 4 weeks. Remember: ENSO has a life cycle of 1 to 2 years, so the MJO operates on a much shorter time scale.
Because the MJO influences rain and thunderstorm development it creates a favourable environment for the formation of tropical cyclones. New Zealand typically experiences one ex-tropical cyclone per tropical cyclone season, which runs from 1 November to 30 April.
Climate driver four: Southern Annular Mode
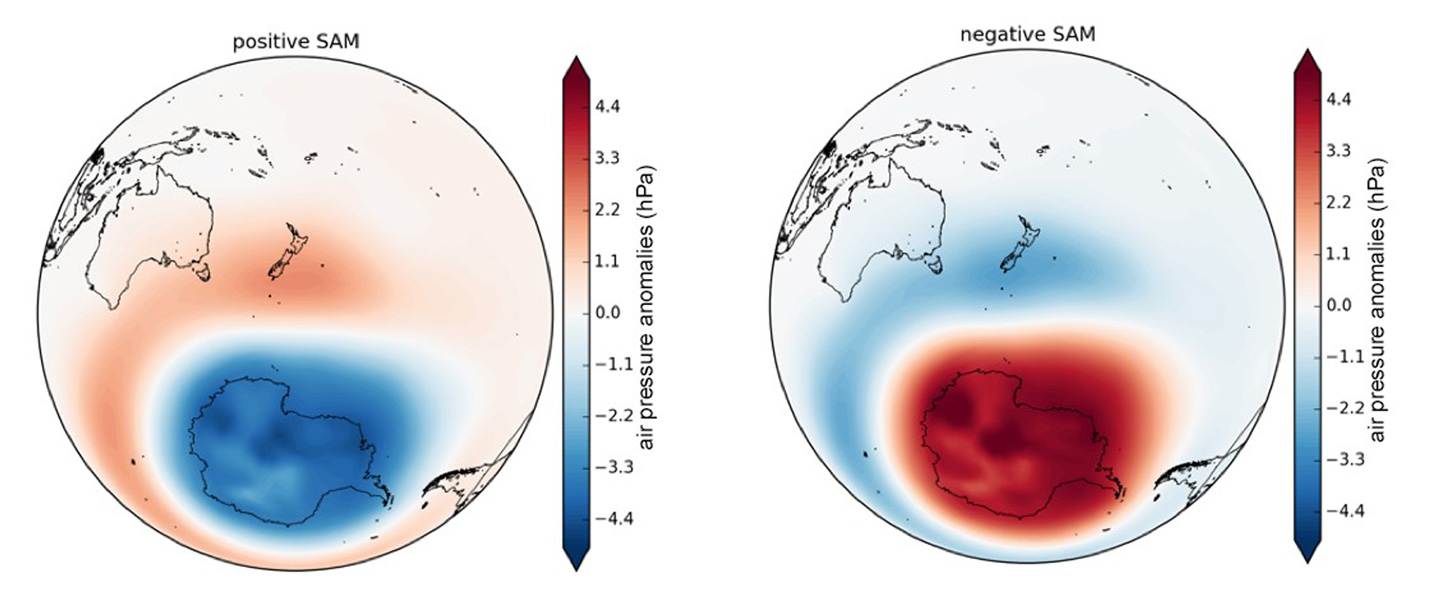
The Southern Annular Mode (SAM) involves alternating windiness and storm activity between the mid-latitudes, where New Zealand is located, and higher latitudes, such as over the Southern Ocean and Antarctica.
There are two phases of the SAM: positive and negative. In short, when the SAM is positive, the weather is more likely to be nice across Aotearoa.
Positive SAM is associated with higher than normal air pressure in the New Zealand region, meaning we experience light winds and tranquil weather conditions. Meanwhile, wind and storm activity typically increase over the Southern Ocean and Antarctica.
Negative SAM usually results in lower than normal air pressure around New Zealand and higher pressure south of the country. Winds tend to increase around New Zealand, increasing the risk for unsettled weather conditions. The weather tends to be a bit calmer in the Southern Ocean, where winds are weaker than normal.
Forecasters look to the phase of the SAM to help understand if the next few weeks will be sunny and dry or cool and damp.
By now, you might be thinking that predicting the weather and climate is pretty complicated? And you’re right! But our understanding of how the climate works is ever-increasing, which makes it possible to predict how it will behave in the future.
Experiment – El Niño in action!
A hands-on demonstration of the El Niño effect, trade winds, and upwelling. (This experiment comes from https://sealevel.jpl.nasa.gov/files/ostm/make-your-own-el-nino.pdf)
What you'll need:
- Clear plastic rectangle-shaped container (such as a food container approx. 40 cm x 10 cm x 10 cm)
- Water
- Mineral oil
- Blue food colouring
- Hair dryer
- Red oil-based paint - optional
- Paper sheet map showing the Pacific Ocean
Instructions:
- Fill the tray with water to within 3cm of the top.
- Add blue food colouring to the water in until a nice "ocean blue". (Some of the food colouring will settle to the bottom which is fine because this will show the upwelling.)
- Pour some mineral oil in a bowl and mix in some red oil-based paint until the oil is evenly coloured.
- Gently pour the oil over the surface of the water. (It's okay if it mixes a bit because it will separate out again.)
- Put the container on the paper and mark East and West at either end, Indonesia and South America.
- Plug in hair dryer, being careful to keep it away from any water spills.
Explanation
The liquids in the plastic container represent a slice across the Pacific Ocean in the vicinity of the equator. The red-coloured oil represents the warm layer of surface water that has been heated by the sun. The blue water represents the colder water below the surface warm layer. The hairdryer is about to represent the trade winds.
Stage 1: Have a student turn on the hairdryer (no heat needed) and direct the 'wind' across the surface of the oil-topped water from the East to the West. Ask the class to describe what effect this has on the "warm" and "cold" water.
Comments: Note that the "warm" water piles up in the West as it is blown by the hair dryer. This is the normal wind condition for the equatorial Pacific Ocean. Discuss the location of the warm water on the globe. You may notice that the sediment of the blue food dye moves upwards towards the surface at the east end (this will only happen if there is a sediment). This is upwelling which, in the Pacific Ocean, brings nutrient-rich bottom waters to the surface. Plankton feed on the nutrients, and in turn fish feed on the plankton, so these areas tend to be rich in fish and other sea life.
Stage 2: Have the student turn off the hair dryer and ask the class to describe what happened when the winds stop.
Comments: You may need to do this several times to observe the motion. The "warm" water pulses across the "ocean" from west to east, this pulse of water is the warm water that is the oceans part of the El Niño condition.
Quiz - climate drivers
Check out our climate drivers quiz. The quiz works best on Kahoot, but if you prefer a text version, you can download it as a PDF.