Background
Most urban climate change risk and impact assessments for stormwater and wastewater management concentrate on the need for quantity control to limit the risks of flooding or combined sewer overflows due to increased rainfall intensity, and, in some cases, land use change.
The case study
The objectives of this case study were to provide an example of how a risk assessment of an urban drainage system can be undertaken using an existing operational model; demonstrate use of output from NIWA's Regional Climate Model (RCM) in a real-world application; assess the possible effect of climate change on the North Shore trunk wastewater network; and to assess the impact of accounting for climate change (i.e., adaptation) to maintain the target level of service on the costs of the proposed capital works programme.
At the time of modelling, RCM rainfall data were available for the Auckland region for only a single global circulation model (HadAM3P) and gas emission scenario (A2). Hence, while this tool can serve as an example of how climate change and socio-economic scenarios can be incorporated into urban drainage models for impact assessment, it is not consistent with the Ministry of Environment (2008) requirements for detailed analysis as part of their recommended risk assessment process.
Tools associated with the Auckland wastewater case study
| Tool Name | Tool Reference | Key Figure / Table / Conclusion |
|---|---|---|
| Sensitivity Matrix Tool for Assessing Vulnerability of Urban Environments to Climate Change | [Tool 1.6] | Appendix: Auckland sensitivity matrix. Stormwater and wastewater drainage were identified as a significant vulnerability. |
| Incorporating climate change into urban stormwater management | [Tool 2.4.2] | Conclusions: Both the interviews and literature review found that the MfE 'Preparing for Climate Change' guidance manual (2008) is the main source of climate change guidance used to inform stormwater management in the Auckland region. MfE guidance for the assessing the impacts of sea level rise (MfE, 2009) and flood risk (MfE, 2010) were also cited as tools used by stormwater practitioners. |
| Climate change guidance material for urban stormwater management | [Tool 2.4.3] | Conclusions: The technical guidance material can be split into two groups. In the first group are the documents prepared by MfE which have a strong emphasis on natural hazard risk identification and management including evaluation of adaptation strategies. The second group of guidance documents consists of national and regional design criteria for drainage infrastructure including stormwater management devices. The main focus is on stormwater design for green and brown-fields developments rather than adaptation of existing systems. |
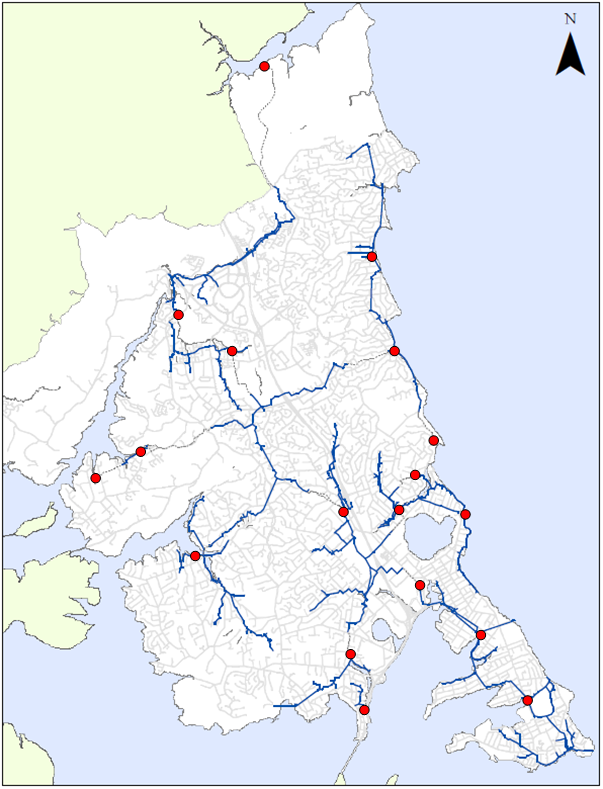
| Modelling the North Shore City Council wastewater network – a case study of potential climate change impacts | [Tool 2.4.4] |
Conclusions: Costs due to climate change were estimated assuming adaptation as part of the capital works (i.e., anticipated climate change) and delayed adaptation carried out 10 years after the capital works (i.e., unanticipated climate change). It was found that the former is more cost effective than the latter. With the assumption of network deterioration due to aging, anticipated climate change adds a maximum of 14% to the overall costs compared to between 30 and 45% for unanticipated climate change. The NPV cost, assuming a 2.5% discount rate, is somewhat lower at between 24 to 36%. If no network aging is assumed, the costs of the planned capital works estimated with the historical rainfall record drops to $314 million. Adaptation for anticipated climate change increases this estimate to between $320 and $373 million. Thus, the cost implications of adapting to climate change are less than that of accounting for network aging. |
| Adaptation by design: impact of climate and land use change on the sizing of stormwater management devices | [Tool 4.7] |
Conclusions: This tool has used national and locally available guidance on climate change adaptation (MfE, 2008) and stormwater design (TP108; TP10) to investigate how the sizing of ponds and raingardens may need to change over this century. Response-curves have been constructed in order to convey the range of sizes possible for ponds and raingardens given our current understanding of climate change and trends in urbanisation. The results suggest that an incremental adaptation strategy, whereby adaptation traces changes in risk over time, is appropriate for ponds. Increasing imperviousness and rainfall both increase the storage demand of ponds. Pond design is at least as sensitive to imperviousness as to changes in design rainfall. |
References
Ministry for the Environment (2008) Preparing for climate change: A guide for local government in New Zealand. Publication number: ME 891.
Related links
- Other Urban Impacts Toolbox case studies
- Climate variability and change
- NZ temperature record
- Climate change scenarios for New Zealand