NIWA's Traffic Impact Model (v.2)
On this page you can download our latest maps of long-term average concentrations of black carbon from road traffic. Equivalent maps for nitrogen dioxide (NO2) are coming soon.
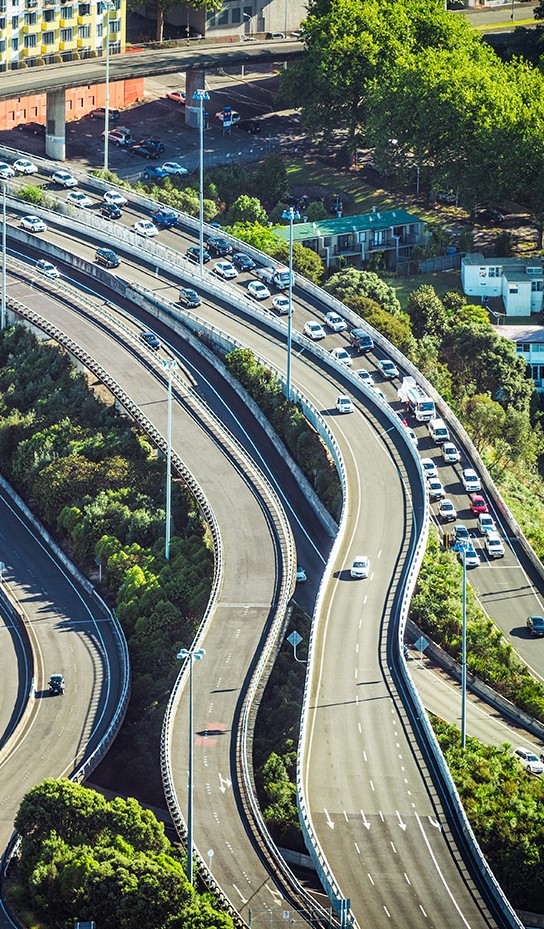
Black carbon, commonly known as soot, is made of microscopic particles generated by incomplete combustion, but especially diesel vehicle exhaust. Exposure to black carbon is increasingly linked to heart and lung disease. It is also a short-lived climate pollutant with a strong climate warming effect, second only to carbon dioxide.
NO2 is a toxic gas that can aggravate asthma, increases the risk of respiratory infection in children and can impair childhood lung development. In New Zealand towns and cities road traffic exhaust is by far the major source, especially diesel vehicles. The World Health Organization sets a guideline of 40 micrograms m-3 as an annual average, although it recognises that adverse effects can occur at lower levels if NO2 is mixed with particles, as is the case in road traffic exhaust.
Download maps of black carbon
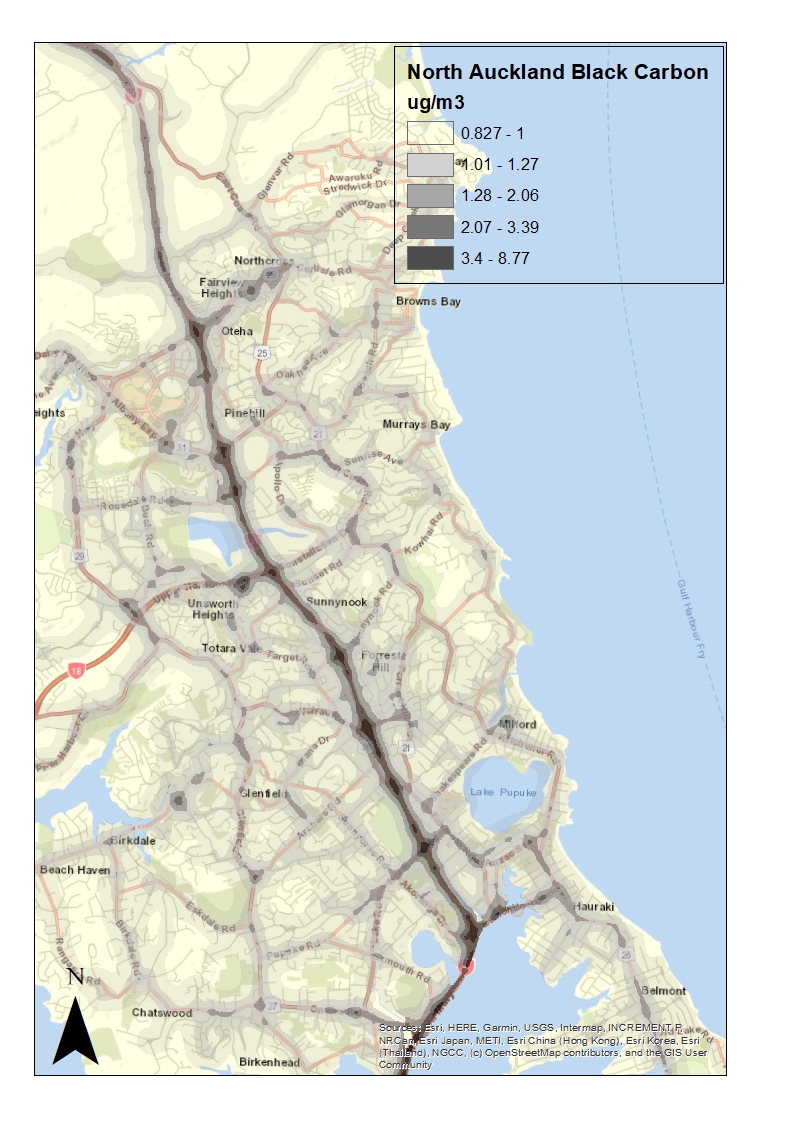
- North Auckland
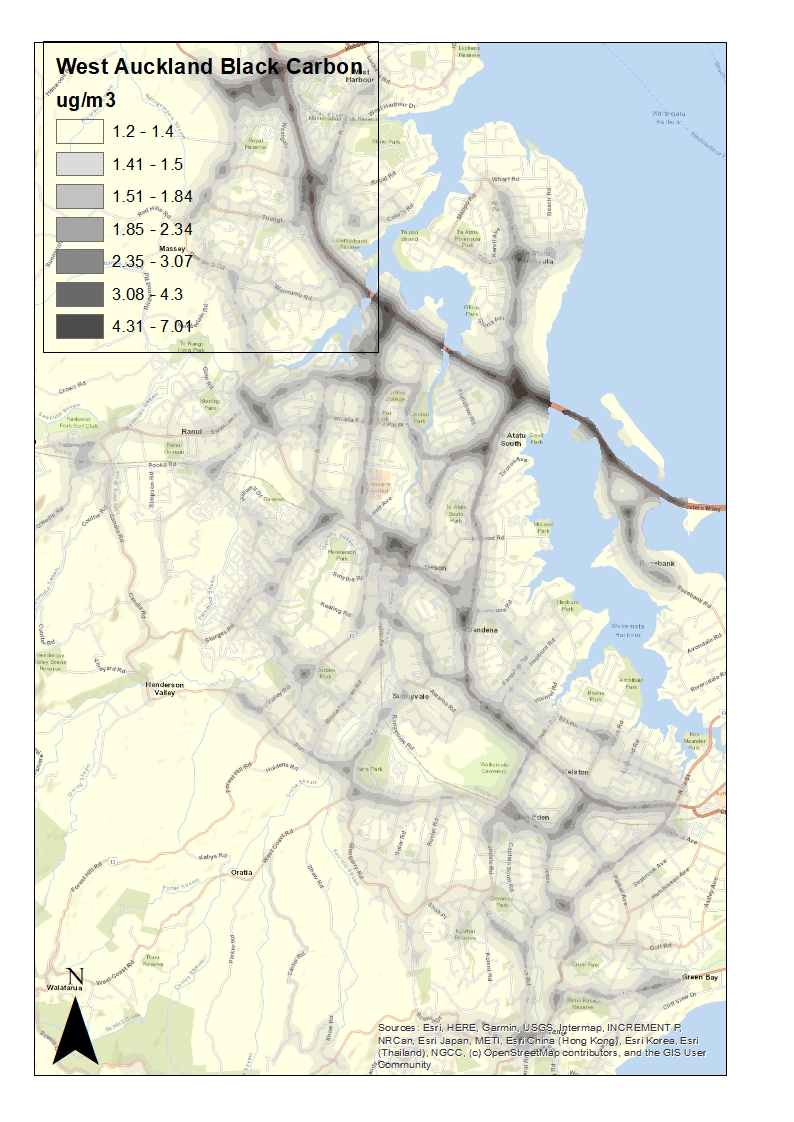
- West Auckland
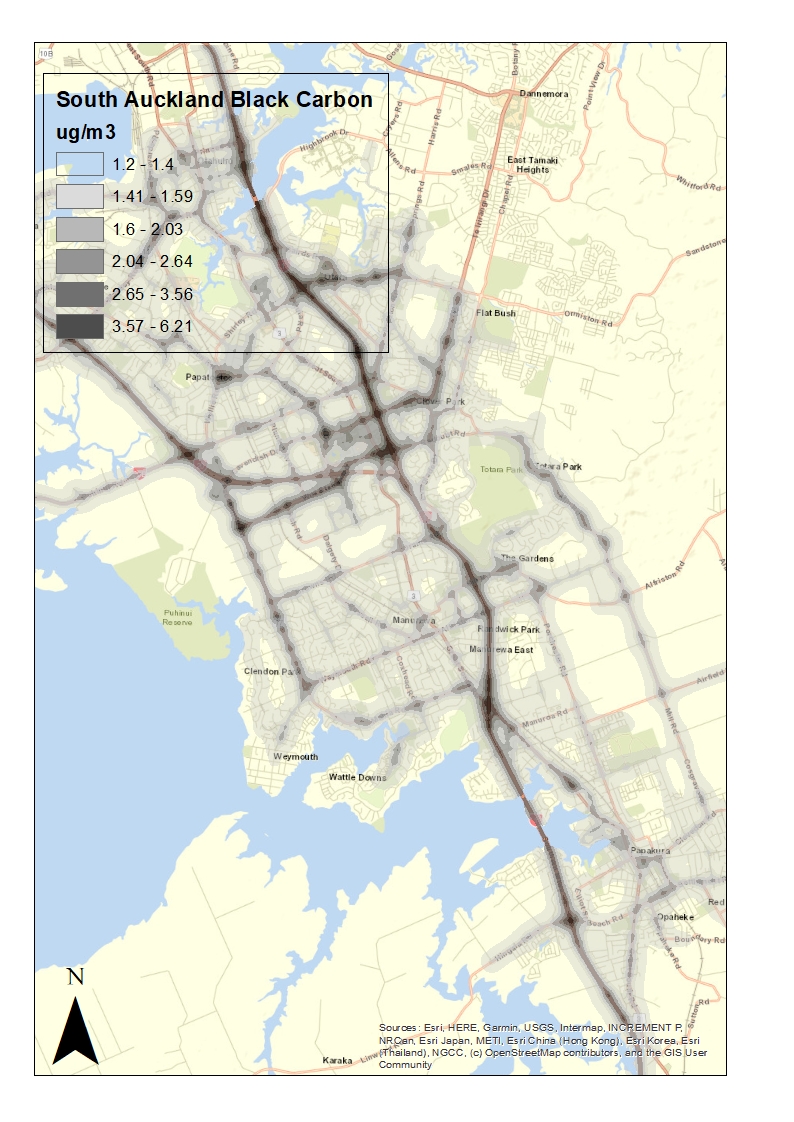
- South Auckland
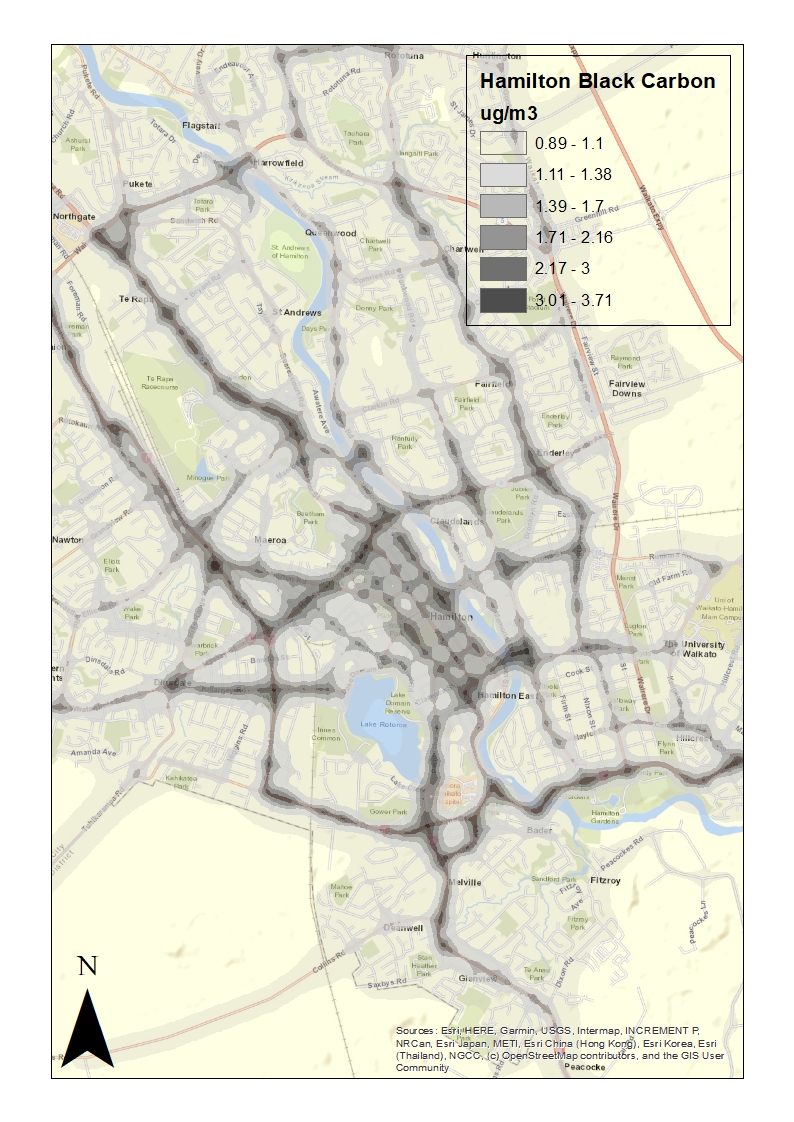
- Hamilton
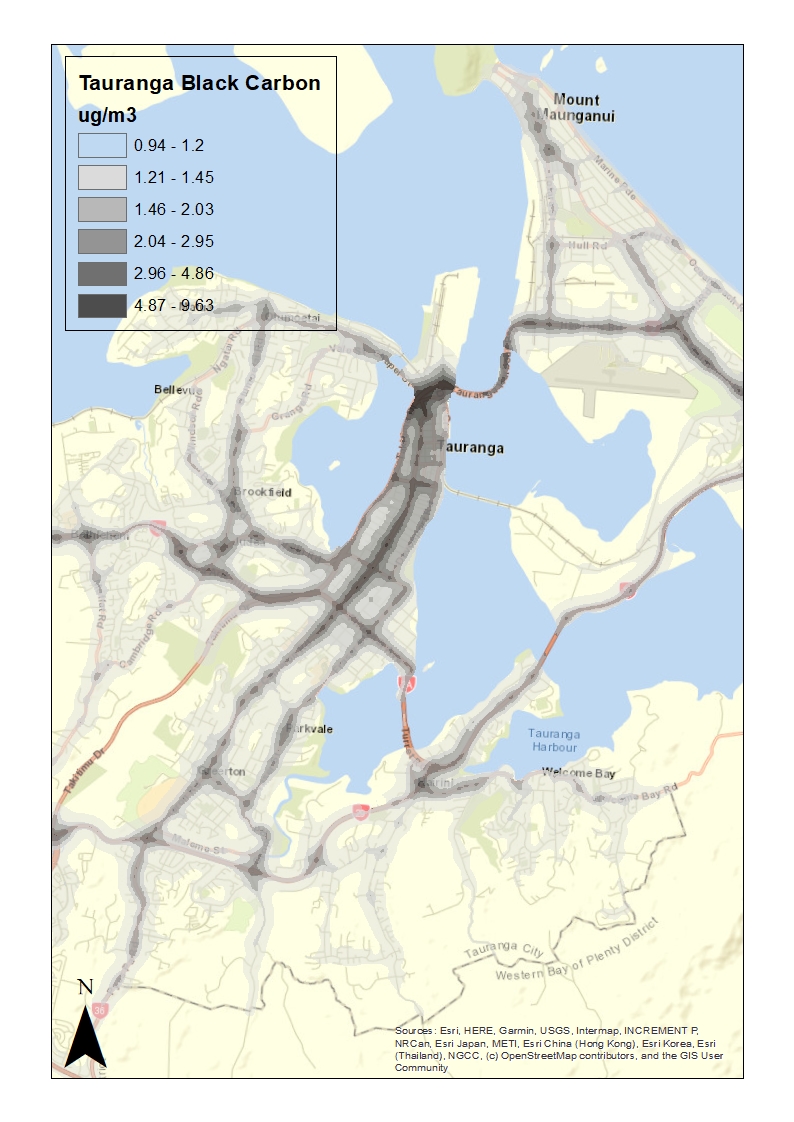
- Tauranga
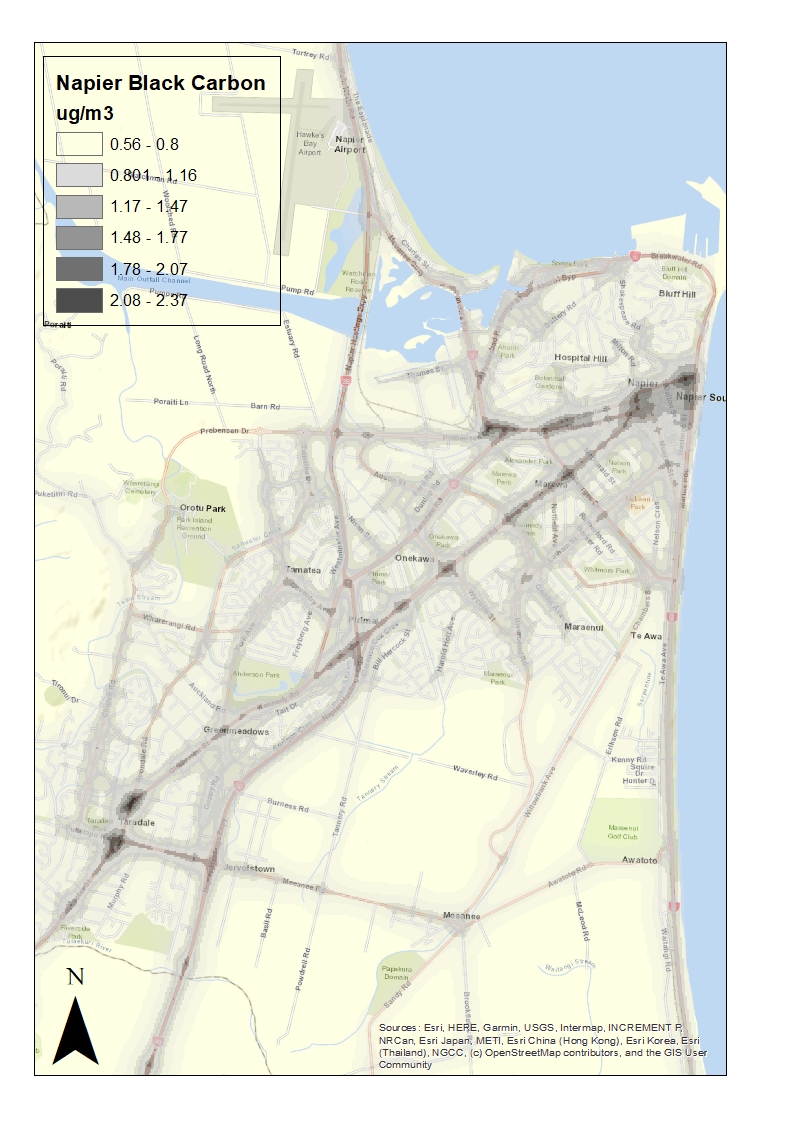
- Napier
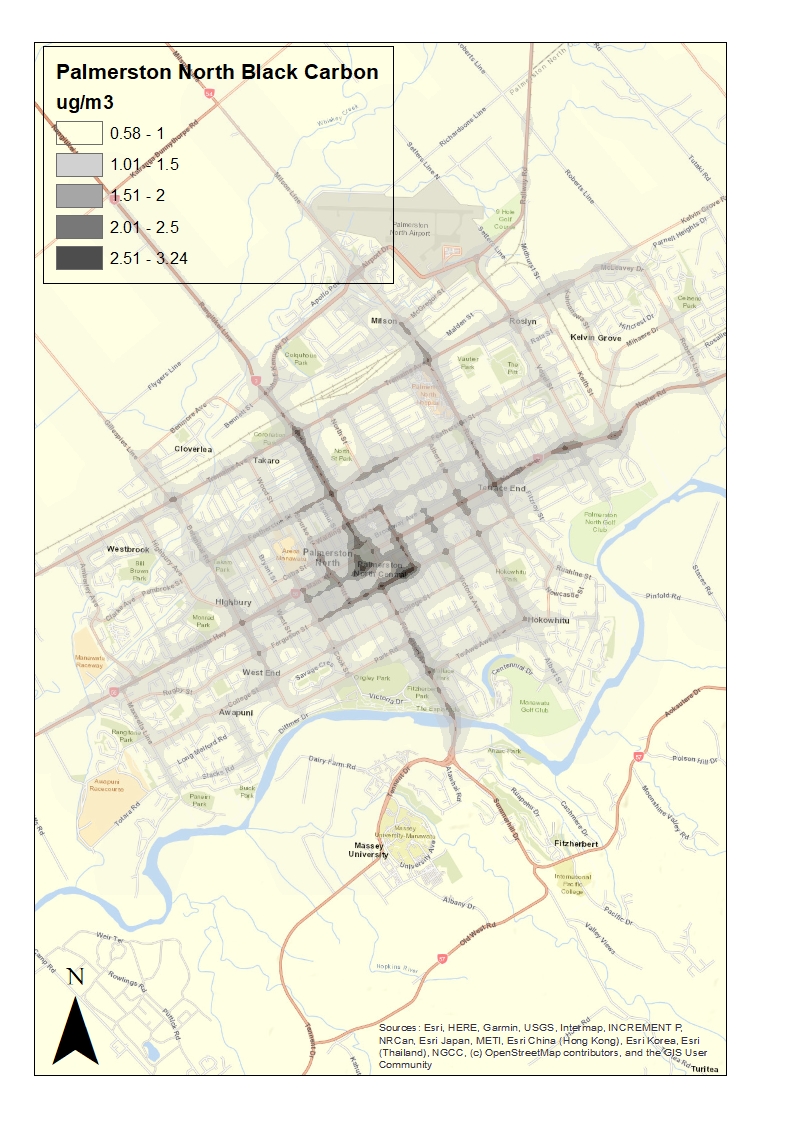
- Palmerston North
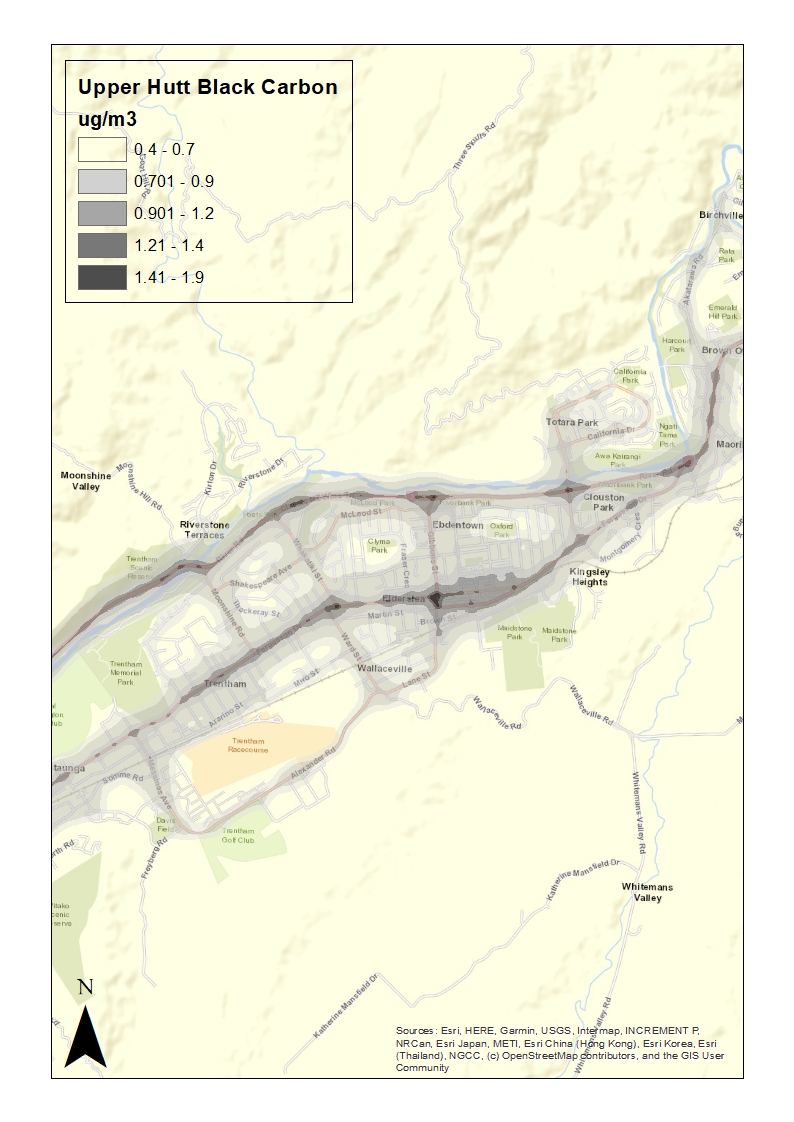
- Upper Hutt
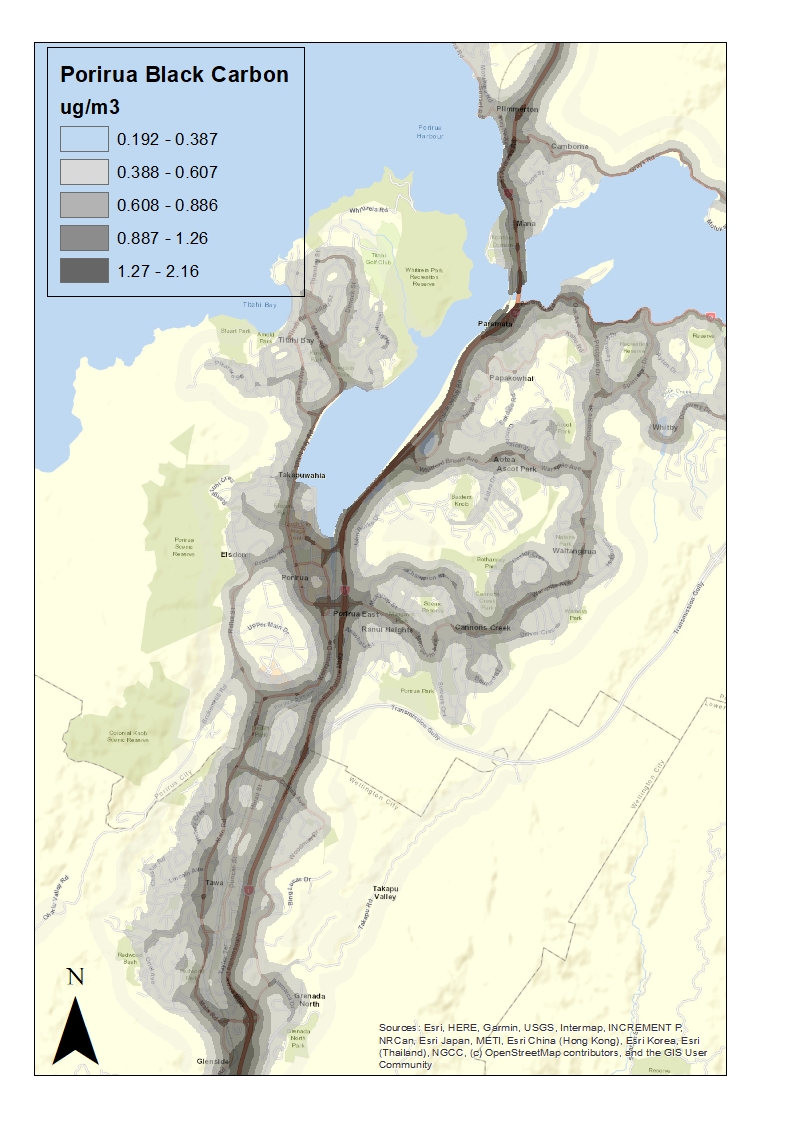
- Porirua
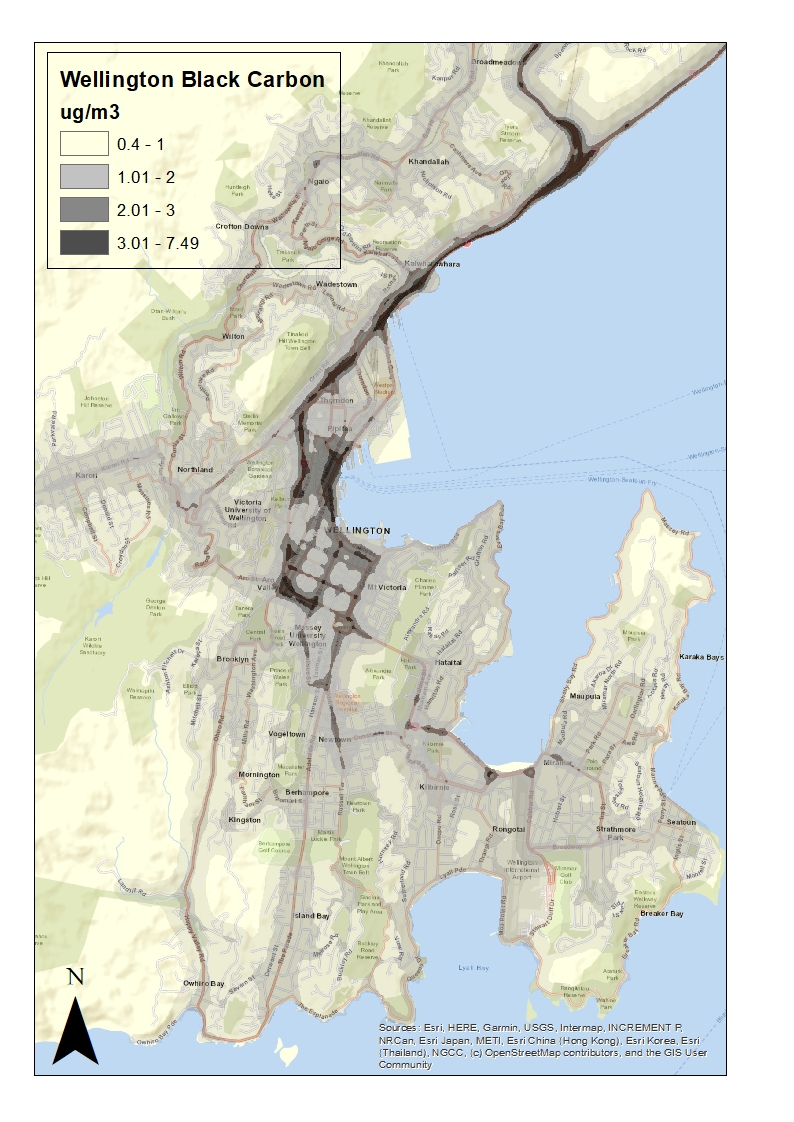
- Wellington
Christchurch and Dunedin are coming soon.
About the model
Version 2 of the Traffic Impact Model is currently under development. It is a ‘semi-empirical’ model combining measurement data from hundreds of locations collected by several organisations, with physical principles of dispersion to provide the most detailed picture of the spatial patterns in road traffic pollution available.
Ongoing work at NIWA is expanding the coverage, improving the accuracy, and increasing the range of pollutants covered by the model. Updates to the model will be released as they are available.
Limitations and caveats
The current version of the model has a number of known limitations, which we are working to reduce:
- The model predicts pollutant levels due to road traffic sources only. Observed pollutant levels may be slightly higher in the vicinity of other major emission sources, such as industrial boilers, large power plant, airports, seaports and busy rail yards.
- The current model is known to underestimate concentrations where diesel vehicles are an unusually large proportion of the vehicle fleet, such as on roads dominated by buses or trucks.
- The model does not yet cover towns and cities with very little observational data.
Technical details and documentation
Coming soon!
Version history
1.0 For research purposes only.
2.0 Current version. Released 26/6/2019.
About the maps
You can download our latest maps of long-term average concentrations of nitrogen dioxide (NO2) and black carbon (BC).
Nitrogen dioxide is a toxic gas that can aggravate asthma, increases the risk of respiratory infection in children and can impair childhood lung development. In New Zealand towns and cities road traffic exhaust is by far the major source, especially diesel vehicles. The World Health Organisation sets a guideline of 40 mg m-3 as an annual average, although it recognises that adverse effects can occur at lower levels if NO2 is mixed with particles, as is the case in road traffic exhaust.
Black carbon (commonly known as soot) is made of microscopic particles generated by incomplete combustion, but especially diesel vehicle exhaust. Exposure to black carbon is increasingly linked to heart and lung disease. It is also a Short-Lived Climate Pollutant (SLCP) with a strong climate warming effect, second only to carbon dioxide.
Our Traffic Impact Model maps shows the annual average concentrations of nitrogen dioxide and black carbon arising from road traffic only.
About the model
The Traffic Impact Model is currently under development at NIWA. It is a ‘semi-empirical’ model combining measurement data from hundreds of locations collected by several organisations, with physical principles of dispersion to provide the most detailed picture of the spatial patterns in road traffic pollution available. Ongoing work at NIWA is expanding the coverage, improving the accuracy, and increasing the range of pollutants covered by the model. Updates to the model will be released as they become ready.
Coverage
The model currently covers Wellington, Hamilton, Tauranga and several other towns and cities.
Auckland, Christchurch and Dunedin are coming soon.
Limitations and caveats
The current version of the model has a number of known limitations, which we are working to reduce:
· The model predicts pollutant levels due to road traffic sources only. Observed pollutant levels may be slightly higher in the vicinity of other major emission sources, such as industrial boilers, large power plant, airports, seaports and busy rail yards.
· The current model is known to under-estimate concentrations where diesel vehicles are an unusually large proportion of the vehicle fleet, such as on roads dominated by buses or trucks.
· The model does not yet cover towns and cities with very little observational data.
Technical details and documentation
Coming soon!
Version History
1.0 For research purposes only.
2.0 Current version. Released 26/6/2019.