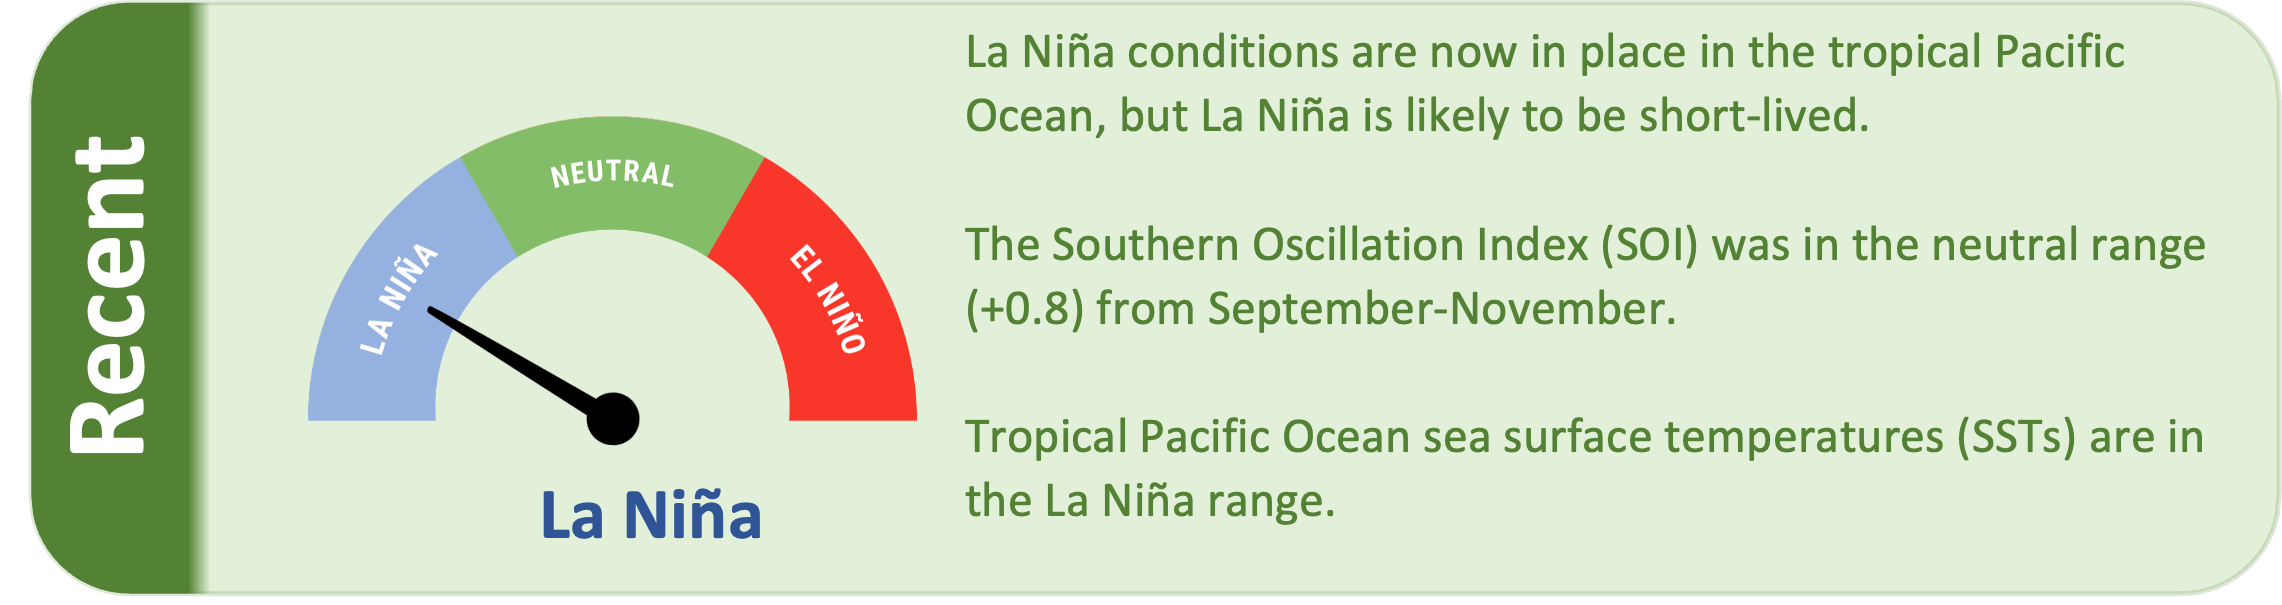
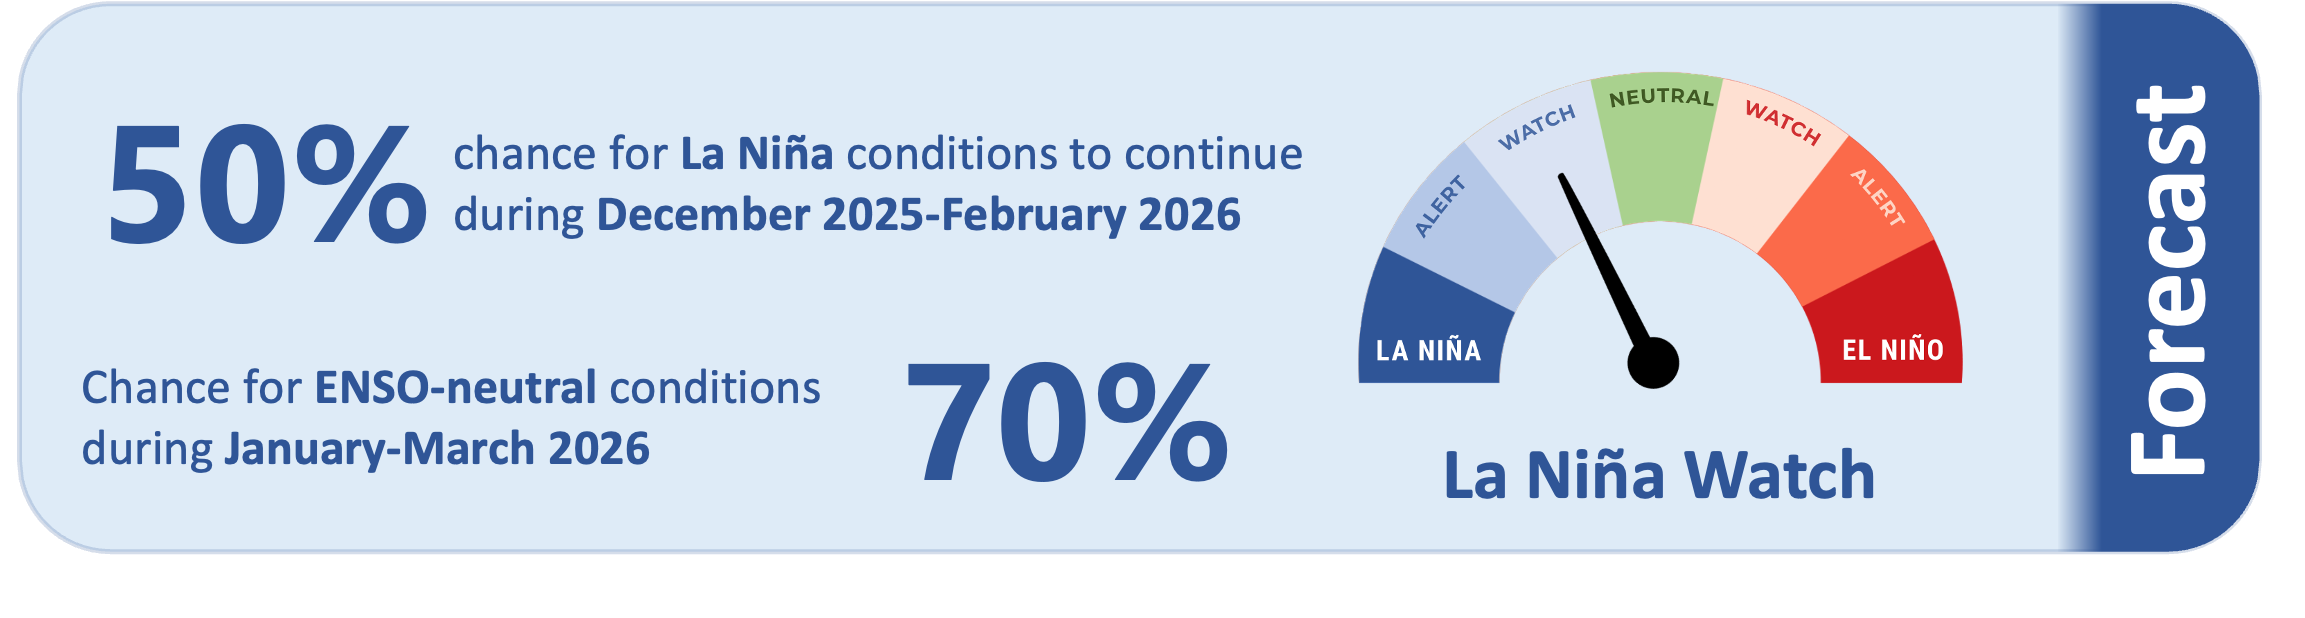
Island Climate Update

A monthly summary of the climate in the tropical South Pacific islands, with an outlook for the coming months.

April-June 2024 Island Climate Update

El Niño continued during March but continues to weaken. ENSO neutral conditions are favoured to develop by June 2024.

The monthly NINO3.4 Index anomaly (in the central equatorial Pacific) at the end of March was +1.24˚C, remaining within the El Niño range. Oceanic El Niño has weakened by about 0.55˚C since January.

The Southern Oscillation Index (SOI) was in the neutral range during March (+0.1) and January-March (-0.2).

Trade wind strength was well above normal near and west of the International Date Line during March. This generated an upwelling Kelvin Wave in the west-central equatorial Pacific, which should see cooler than average sub-surface ocean water move across the Pacific over the next two months.

Enhanced trade winds are forecast to continue near the International Date Line during April, which should result in additional oceanic cooling.

At the end of March, the subsurface equatorial Pacific was cooler than average across most of the basin below 100 m depth, with below average temperatures moving closer to the surface in the east during March. Notably, subsurface waters were 3˚C to 5˚C below average in the east, lending credence to the eventual development of La Niña later this year.

During March, convective forcing favoured the western Pacific with subsidence over the eastern Pacific and South America, a La Niña-like pattern. This was linked to a strong, early-month pulse of the Madden-Julian Oscillation (MJO) as well as a South Pacific Convergence Zone that was displaced well south-west of its climatological position. This delivered excessive rainfall to Vanuatu, Fiji, and parts of Tonga during the month. By late March, the pulse had propagated into the eastern Pacific, generating an El Niño-like response. Such variability is to be expected from an ocean-atmosphere system that is transitioning toward an ENSO-neutral state.

The tropical cyclone season continues through April. Activity looks unlikely through the first half of the month.

Download

Additional resources

Additional regional and country situation summary and forecast information can be obtained below. Current rainfall accumulation status and other derived summary information are updated on a daily basis (with a 2-day lag), with seasonal forecast information updated once per month.

About the Island Climate Update

NIWA is the Network co-lead for the WMO RA V Regional Climate Centre Node on Long Range Forecast and consortium member for nodes on Climate Monitoring, Operational Data Services and Training.

Development and production of the ICU is supported by NIWA Strategic Science Investment Funding under contract PRAS2301. The Island Climate Update bulletin and associated video and products are prepared as soon as possible at the start of each month. Delays in data availability occasionally arise. While every effort is made to verify the data, NIWA does not guarantee the accuracy and reliability of the analysis and forecast information presented and accepts no liability for any losses incurred through the use of this bulletin and its contents. The contents of this bulletin and all associated products produced by the Island Climate Update may be freely disseminated provided the source is acknowledged.

You can follow the Island Climate Update on Facebook and Twitter.

View past monthly Island Climate Update issues (2001 to present) here Island Climate Update | NIWA

Issues

  • (no image provided)

    Island Climate Update 259 - April 2022

    The NINO3.4 Index anomaly over the last month (to 3 April) was -0.79˚C, near the La Niña threshold. The March monthly Southern Oscillation Index (SOI) was +1.4, in the La Niña range.
  • (no image provided)

    Island Climate Update 258 - March 2022

    The NINO3.4 Index anomaly (in the central Pacific) during February was -0.60˚C, near the La Niña threshold. The monthly Southern Oscillation Index (SOI) was +0.7 and the three-month average SOI was +0.8, the latter near the La Niña threshold.
  • (no image provided)

    Island Climate Update 257 - February 2022

    The NINO3.4 Index anomaly (in the central Pacific) during January was -0.70˚C, in the La Niña range. The monthly SOI was +0.3 and the three-month average SOI was +0.9, the latter near the La Niña threshold.
  • (no image provided)

    Island Climate Update 256 - January 2022

    The NINO3.4 Index anomaly (in the central equatorial Pacific) over the last month was -0.68˚C, near the La Niña threshold. The monthly Southern Oscillation Index (SOI) was +1.3 and the three-month average SOI was +1.0, both in the La Niña range.
  • (no image provided)

    Island Climate Update 255 - December 2021

    The NINO3.4 Index anomaly (in the central Pacific) during November (through the 28th) was -0.59˚C and the Southern Oscillation Index (SOI) was +1.1, both near the La Niña threshold. The three month average SOI was +0.9.
  • (no image provided)

    Island Climate Update 254 - November 2021

    The NINO3.4 Index anomaly (in the central Pacific) during October was -0.59˚C. The latest weekly value was -0.80˚C, continuing the trend towards La Niña. The Southern Oscillation Index (SOI) was +0.7 during October and August-October, on the La Niña side of neutral. Overall, this represented an ocean-atmosphere system that was on the verge of La Niña conditions.
  • (no image provided)

    Island Climate Update 253 - October 2021

    The NINO3.4 Index anomaly (in the central Pacific) during September was -0.23˚C. Compared to this time last year, conditions are about 0.5˚C warmer. The Southern Oscillation Index (SOI) was +0.8 during September, on the La Niña side of neutral. Notably, the three-month average SOI was +1.0, in La Niña territory.
  • (no image provided)

    Island Climate Update 252 - September 2021

    The NINO3.4 Index anomaly (in the central Pacific) during August was -0.17 ̊C. The Southern Oscillation Index was +0.5. While both remained in neutral territory, other indicators trended toward La Niña.
  • (no image provided)

    Island Climate Update 251 - August 2021

    The NINO3.4 Index anomaly (in the central Pacific) during July was 0.08 ̊C. The Southern Oscillation Index was +1.7, firmly in La Niña territory.
  • (no image provided)

    Island Climate Update 250 - July 2021

    The NINO3.4 Index anomaly (in the central Pacific) during June was 0.18 ̊C, the first time it has been positive since July 2020. The Southern Oscillation Index was +0.4, in the ENSO neutral range.
  • (no image provided)

    Island Climate Update 249 - June 2021

    The NINO3.4 Index anomaly (in the central Pacific) during May (through the 30th) was -0.11˚C, the smallest anomaly since July 2020. The Southern Oscillation Index (SOI) was +0.5, in the ENSO neutral range.
  • (no image provided)

    Island Climate Update 248 - May 2021

    The NINO3.4 Index anomaly (in the central Pacific) during April was -0.30⁰C and the SOI (Southern Oscillation Index) was +0.3, both within the neutral range.
  • (no image provided)

    Island Climate Update 247 - April 2021

    The NINO3.4 Index anomaly (in the central Pacific) during March was -0.44˚C. This marked the first time since August 2020 that SSTs in this region were in the neutral range. The SOI value for March was +0.1 (in the neutral range).
  • (no image provided)

    Island Climate Update 246 - March 2021

    The NINO3.4 Index anomaly (in the central Pacific) during January was -0.68˚C, entering ENSO “cool neutral” territory (-0.5 to -0.69˚C) for the first time since August 2020.
  • (no image provided)

    Island Climate Update 245 - February 2021

    The NINO3.4 Index anomaly (in the central Pacific) during January was 0.81˚C, increasing slightly compared to the previous month.
  • (no image provided)

    Island Climate Update 244 - January 2021

    The NINO3.4 Index anomaly (in the central Pacific) for the last month (through the 3 rd of January) was 0.84˚C, increasing from 1.03˚C from last month.
  • (no image provided)

    Island Climate Update 243 - December 2020

    During November, the NINO3.4 Index anomaly (central Pacific) was 1.02˚C. The NINO 1+2 Index (eastern Pacific) was 0.54 C. The most unusually cool SSTs have now shifted into the central Pacific.
  • (no image provided)

    Island Climate Update 242 - November 2020

    During October, the NINO3.4 Index anomaly (central Pacific) was 0.86˚C. The NINO 1+2 Index (eastern Pacific) was 0.56 C. Upper oceanic heat content continued to decrease in the east central part of the Pacific basin.
  • (no image provided)

    Island Climate Update 241 - October 2020

    During September, the NINO3.4 Index anomaly (central Pacific) was 0.71˚C. The NINO 1+2 Index (eastern Pacific) was 0.76 C.
  • (no image provided)

    Island Climate Update 240 - September 2020

    During August, the NINO3.4 Index anomaly (in the central Pacific) was 0.42˚ C. The NINO 1+2 Index (eastern Pacific) was 0.85 C.
  • (no image provided)

    Island Climate Update 239 - August 2020

    During July, the NINO3.4 Index anomaly (in the central Pacific) was +0.04˚C. The NINO 1+2 Index (eastern Pacific) was 0.72 C, decreasing from 0.57 C in June.
  • (no image provided)

    Island Climate Update 238 - July 2020

    During June, the NINO3.4 Index anomaly (in the central Pacific) was 0.12˚C. Upper oceanic heat content decreased notably across the east central equatorial Pacific.
  • (no image provided)

    Island Climate Update 237 - June 2020

    During May the NINO3.4 Index anomaly (in the central Pacific) for May was +0.01˚C, with upper oceanic heat content continuing to decrease across the equatorial Pacific.
  • (no image provided)

    Island Climate Update 236 - May 2020

    El Niño Southern Oscillation (ENSO) neutral conditions continued during April 2020. The Southern Oscillation Index (SOI) was +0.1.