ENSO Update
The current atmospheric and oceanic observations show a near neutral El Niño Southern Oscillation (ENSO) state in the tropical Pacific region.
In March 2003, the equatorial Pacific (NINO3 and NINO4) seas surface temperature (SST) started cooling, which also coincided with the weakening of easterly trade winds, four months prior to change in the Southern Oscillation Index (SOI).
During May 2003, there was rapid cooling in the equatorial SSTs, which suggested development of of a cool La Niña event. However, this outcome has now become unlikely, as the cooling has broken down, and models predict continuation of neutral conditions for coming months.
During July 2003, the SOI trended positive for the first time after being negative for the past 16 consecutive months (Fig 1). The El Niño event which developed in mid 2002, reached its peak in late 2002 and began to decay in early 2003 to a neutral state over past the few months.
Over the past 12 months, the climate of the southwest Pacific responded as expected to the El Niño. The equatorial region experienced enhanced convection especially over Western and Eastern Kiribati and Tuvalu with suppressed conditions in the far western and eastern equatorial Pacific (Fig 2).
The persisting negative SOI over the last few months (Fig 1) may increase the risk of suppressed convection affecting the rainfall between Fiji and the Southern Cook Islands in the next few months because of the lag relationship between SOI and rainfall. This is likely to last until the ocean and atmosphere become more organised and coherent.
The El Niño event has ended and conditions have returned to normal in the equatorial region. Most of the global climate models show a consensus for a neutral state until early 2004.
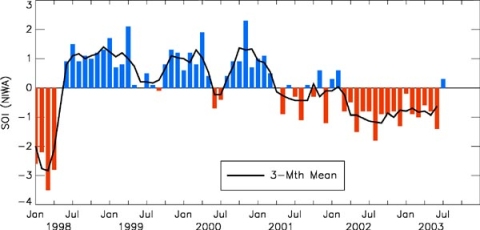
Figure 1 Southern Oscillation Index
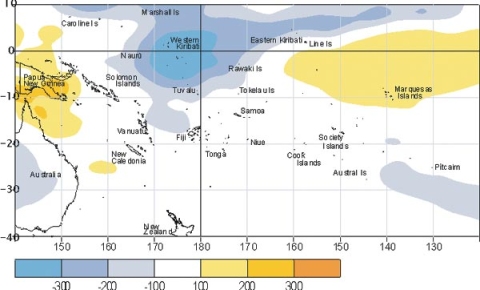
Figure 2 El Niño associated convective pattern (August 2002 through to July 2003) Outgoing Long-wave Radiation (OLR) anomalies, in Wm-2 are represented in hatched areas. High radiation levels (yellow) are typically associated with clearer skies and lower rainfall, while cloudy conditions lower the OLR (blue) and typically mean higher rainfall.
Acknowledgements
World Meteorological Organisation (WMO), US National Oceanic and Atmospheric Administration (NOAA), Australian Bureau of Meteorology (BoM), International Research Institute for Climate Prediction (IRI)