On 1 July 2025, NIWA merged with GNS Science to become Earth Sciences New Zealand.

Climate & Weather

Understanding our variable and changing climate is critical for managing resources and reducing risks.

  • (no image provided)

    Mean number of days of ground frost

    These datasets are available in a range of formats.
  • (no image provided)

    Virtual Climate Station data and products

    Virtual climate station estimates are produced every day, based on the spatial interpolation of actual data observations made at climate stations located around the country.
  • (no image provided)

    Hotspot Watch Updates

    This weekly update helps assess likelihood of extremely dry weather preceding a drought.
  • (no image provided)

    Map Chatham

    Education Resource
    Extremes of temperature are rare as the Chatham Islands are small land masses surrounded by sea.
  • Ocean banner

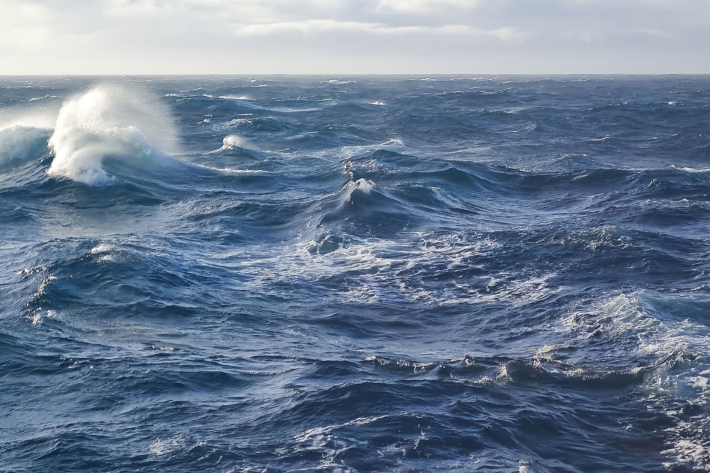
    What is ocean acidification?

    Education Resource
    Ocean acidification is the name given to the lowering of pH of the oceans as a result of increasing carbon dioxide (CO2) in the atmosphere.
  • Regional climatologies

    A regional climatology is a summary of the typical weather and climate of a region, based on historical data observations made at climate stations located within the region.
  • (no image provided)

    NIWA staff profile: Nava Fedaeff

    Feature story
    At the age of seven, NIWA’s youngest climate scientist, Nava Fedaeff, swapped sub-arctic Siberia for balmy Auckland – and her first job was to learn to swim.
  • (no image provided)

    Tuna - glass eels

    Glass eels (about 5.5 to 7.0 cm) arrive in fresh water during spring, especially during September and October, although they may be present from July to December.
  • (no image provided)

    Mean relative humidity

    Dataset available for download
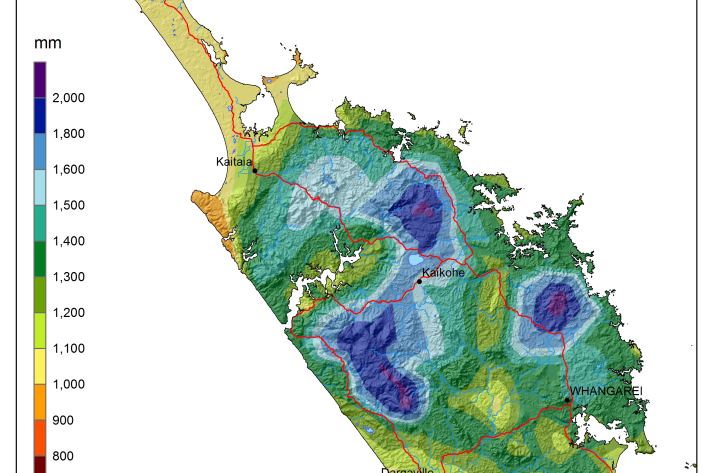
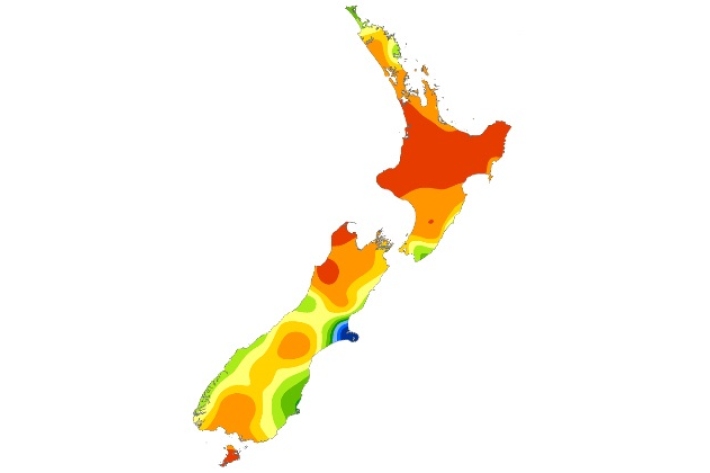
  • National and regional climate maps

    Research Project
    Maps of average annual rainfall, temperature and other climate variables have been produced for all of New Zealand, based on the period 1981–2010.
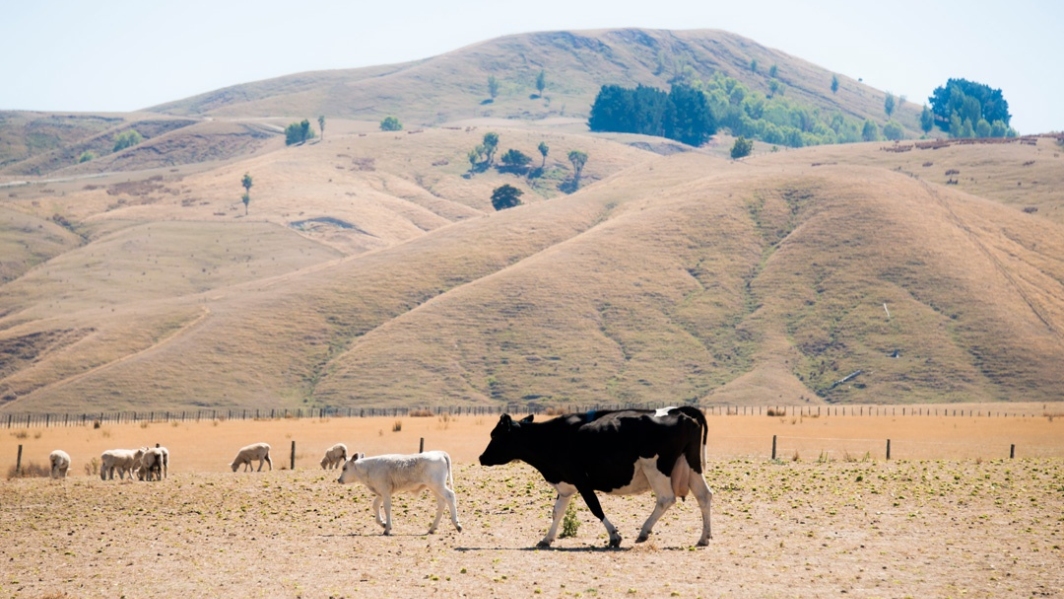
  • The impact of El Niño and La Niña on New Zealand's climate

    El Niño accounts for less than 25 percent of the year-to year variance in seasonal rainfall and temperature at most locations in New Zealand.