-

Blog: Radially Aligned Linear Photosynthetron - 9 March
9 March 2018In the back of Karl Safi’s lab, where we found him working in the semi-dark, is a very futuristic looking piece of kit called the Radially Aligned Linear Photosynthetron (RALPH). -
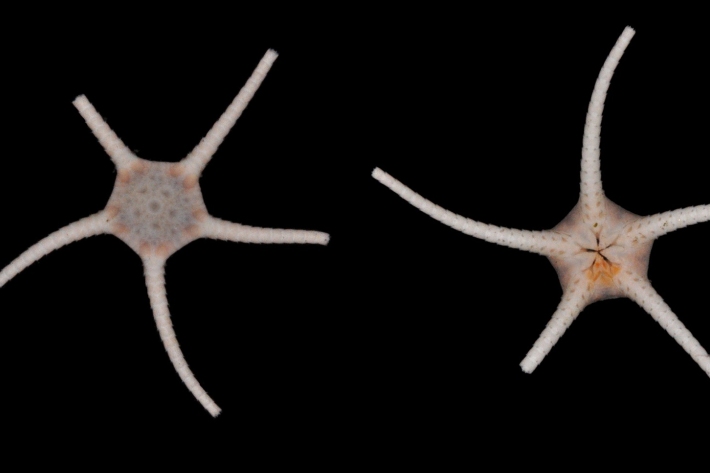
Blog - specimens collected by epibenthic sled - 10 March
10 March 2018To verify the identities of animals we see on the DTIS camera, we use an epibenthic sled to collect physical samples of animals from the seafloor. -
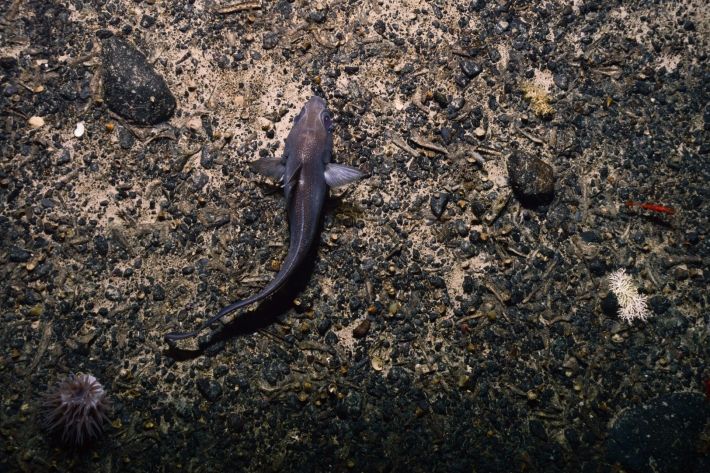
Blog: Long Ridge seamount communities - 7, 8 March
8 March 2018The Benthic team have been observing and identifying animals living on the seabed at Long Ridge, north of the Ross Sea. -

Scientists measure glaciers after record-beating summer
Media release08 March 2018Climate scientists and glaciologists are taking to the skies this week to find out how New Zealand’s glaciers are faring following this summer’s record-breaking warmth. -
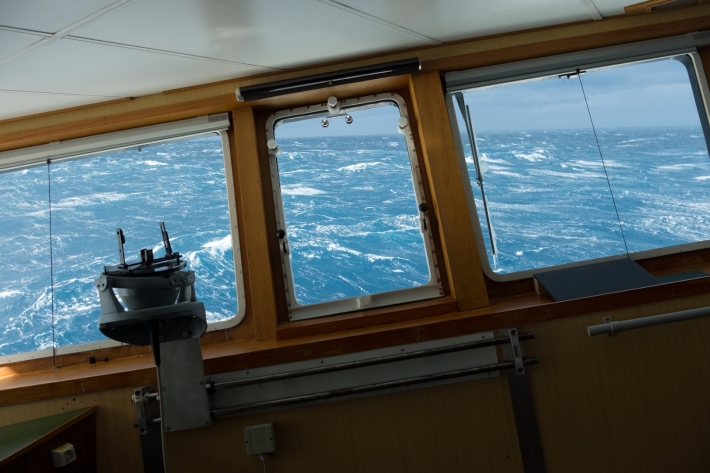
Blog: the screaming sixties - 6 March
6 March 2018Today the screaming sixties are living up to their name. We are at 67°S, just east of Scott Island, and deck work has been suspended temporarily while we weather a storm. -

Blog: atmospheric research - 5 March
5 March 2018Sean Hartery, a PhD student from Canterbury University based at NIWA, is collecting samples and data for two main areas of atmospheric research while he is out here in the Ross Sea: ice nuclei and aerosols. -
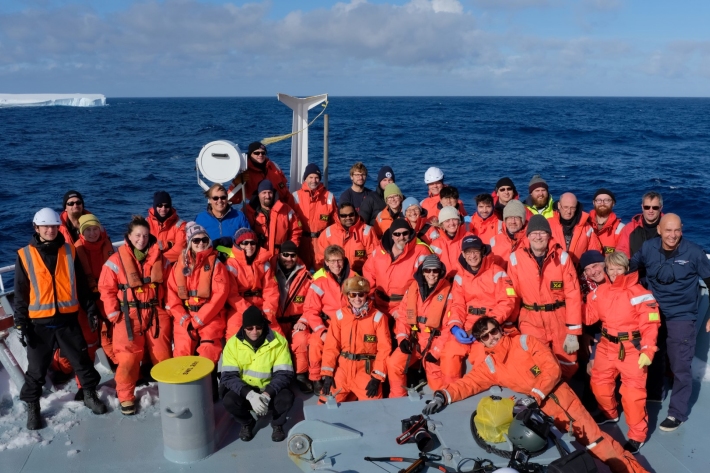
Blog: Team photo, quadcopter and helikite - 2 - 4 March
4 March 2018On Friday the sun shone for the first time in a while, and we sailed close to our second proper iceberg of the voyage. -
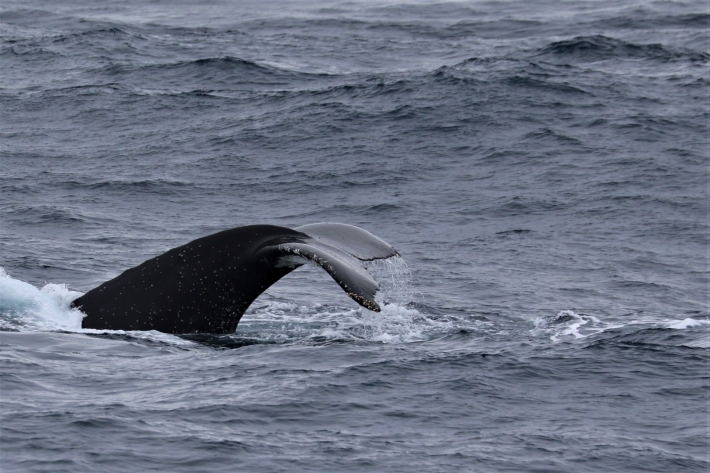
Blog: humpback whales on the Iselin Bank - 1 March
1 March 2018The University of Auckland Cetacean Ecology Team (aka the Whale Team) has been waiting patiently for the last few weeks for an opportunity to get close to some whales. -

Blog: Krill swarms on the Iselin Bank - 28 February
28 February 2018We are slowly zigzagging our way north up Iselin Bank as the mesopelagic team have been running their giant fish finder, the EK60. -
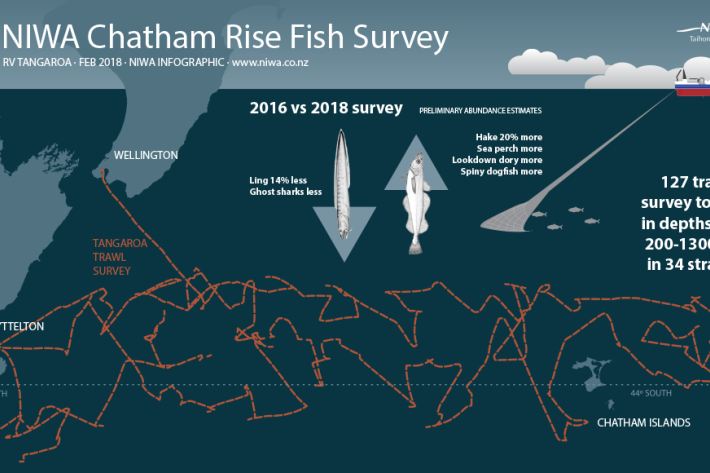
NIWA expertise contributes to healthy hoki fishery
Media release28 February 2018When NIWA fisheries scientist Richard O’Driscoll went to sea earlier this year, he and his team measured so many fish that laid end to end, they would have stretched for 31km. -
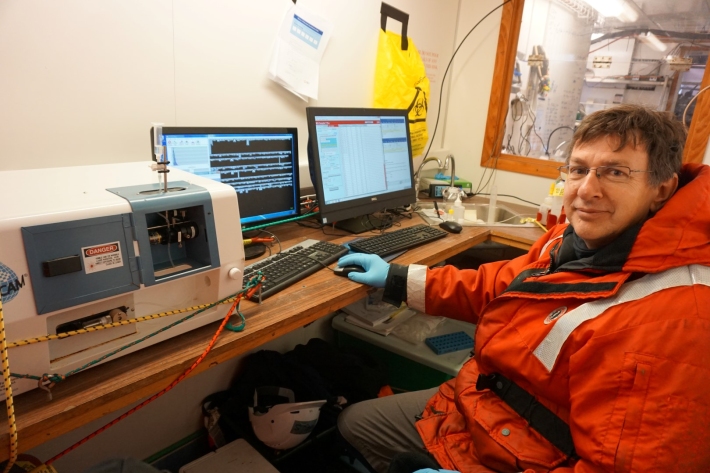
Blog: Ross Sea phytoplankton - 26 February 2018
26 February 2018In the last few days our microbial team has been doing intensive sampling of the water column using the CTD, which is deployed every day around noon.

