PDF of this article (177 KB)

Andrew Swales John Oldman John Radford Iain MacDonald
An experiment in Auckland’s Mangemangeroa estuary is helping us understand what happens to sediment eroded from the land, how much accumulates and how much escapes during floods.
Most sediment is washed into estuaries during floods. These events are difficult to record because they often only last a few hours and can happen any time. But we need a good understanding of what happens during floods if we are to accurately predict the fate of catchment sediments in our estuaries.
Our aging estuaries
The estuaries that we see in New Zealand today formed only 6500 years ago when rising sea level drowned coastal valleys (see “How estuaries grow old”). The life histories of some of our estuaries have been pieced together from dated sediment cores, from which we can estimate how fast sediment has been accumulating.

Before people arrived in New Zealand, our estuaries filled gradually – less than 1 mm/year – with sediment from both the land and the sea. However, in the last 150 years, widespread removal of native forest and, more recently, urban development have greatly increased the amount of sediment runoff from the land. As a result, average sedimentation rates in our estuaries today are typically 10 times or more higher than before humans arrived. For example, research in some North Island estuaries has shown that sedimentation rates in their upper reaches have averaged as much as 20 mm/yr over the last 50 years. The effects of such rapid sedimentation on the longevity and ecology of estuaries can be far-reaching. (See “How estuaries grow old”, “Sediment dumps in estuaries” and “Fringing habitats in estuaries” for examples.) Today, many of our estuaries have infilled to the extent that they are largely intertidal and much of their beds is exposed at low tide.
Floods and sedimentation
Information gleaned from sediment cores gives us a good idea of the long-term history of our estuaries but provides only part of the story. Average sedimentation rates calculated from sediment cores can give the impression that sediment runoff to estuaries occurs at the same rate all the time. In reality, most sedimentation occurs in estuaries during episodic floods that may last a few hours and happen perhaps only several times each year. For example, in the Mahurangi catchment north of Auckland a single flood in May 1985 delivered 75% of the estimated 20-year annual average sediment runoff to the estuary.
This means that if we want to predict the effects of increased sediment runoff from the land, we need to know what happens in estuaries during floods. One way to investigate this is to make measurements of what actually goes on in estuaries during floods – for example, water flows, sediment dispersal and sedimentation processes in various environments, such as tidal channels, intertidal flats and fringing habitats. We can then use this information to improve predictive models of sediment dispersal and sedimentation.
Modelling to make predictions
Mathematical models are used increasingly to predict the likely consequences of human activities, and several applications have been described in previous issues of Water & Atmosphere. The value of numerical models as environmental management tools lies in their assimilation of knowledge, integration of the effects of the interaction of many processes in time and space and, as a result, an ability to predict the consequences of future events such as increased sediment runoff during catchment development.
Estuary models are usually built in several steps, and the overall accuracy of the model predictions depends on the degree to which we understand the physical and biological processes which underpin them. Modelling sediment dispersal and sedimentation in estuaries during floods is a good example of how our understanding of processes limits the accuracy of models.
In the first step tidal flows are predicted using a hydrodynamic model – for example, see “What regulates sedimentation in estuaries?”. The accuracy of these predictions depends mainly on how accurately we know the shape (bathymetry) of the estuary: we can measure this relatively easily.

The second step involves modelling how freshwater flood runoff mixes with the salty estuary water. This step is important because sediment dispersal is primarily determined by this mixing process. Typically, in largely intertidal estuaries, fresh water and salt water are well mixed most of the time because of the combination of shallow water and strong tidal currents. However, during floods, if the river flow is large in comparison to the tidal flow and the water is deep enough, then we see two changes. Silt-laden freshwater runoff flows out into the estuary on the surface of the saltier, denser estuary water and sediment from the freshwater can settle out into the in-coming “salt wedge” and be transported back to the upper estuary where it is likely to be deposited. This process is called salt-wedge stratification.
Many estuaries – particularly those formed from drowned river valleys – are fringed with small, shallow tidal creeks. Such creeks are largely intertidal so their flows are likely to be well mixed, but it is not clear whether salt-wedge stratification occurs in these environments. This could be important because the degree to which salt wedges modify flows in tidal creeks might have a large influence on flood sediment dispersal and sedimentation.
Flood sediment dynamics: an experiment

We are investigating what happens to flood sediments in estuaries through an experiment in Auckland’s Mangemangeroa estuary, a good example of a tidal-creek estuary which drains to a large, shallow bay.
A “smart” instrument system has been designed to capture what happens during short-lived floods by making frequent measurements in both the catchment and the estuary. We measure catchment sediment runoff using electronic sensors, supplemented by automated sampling of floodwater. In the estuary channel, a sensor mast measures water levels, current speeds, suspended sediment concentrations (SSC) and water salinity at several levels in the water column. Elsewhere in the estuary, other instruments are making similar measurements in mangroves and on the mudflats. By this range of measurements we can build up a detailed picture of how flow conditions change during the flood and how sediments are dispersed and deposited.
Capturing a flood

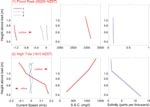
A severe storm in June 2002 – the “Weather Bomb” – was captured by our instruments at Mangemangeroa and the data demonstrate just how complex flow conditions are during floods. The plots above show suspended sediment, salinity and current-speed profiles measured at the flood peak (which occurred at low tide) and at the subsequent high tide. At the flood peak, silt-rich runoff was transported rapidly down the estuary. As the next incoming tide flowed into the estuary and the storm abated, current speeds and suspended sediment concentration in the channel rapidly declined. Then, as high tide approached, a salt wedge gradually evolved and persisted for two hours. The near-surface freshwater layer flowed down the estuary over an opposing salt wedge travelling up the estuary, transporting with it suspended sediments. We can recognise the salt wedge easily from its tell-tale S-shaped velocity profile, shown in the lower left-hand plot. The upper surface of the salt-wedge is identified by a sharp salinity gradient or halocline about one metre above the bed (lower right-hand plot), which coincides with rapid vertical changes in current velocities and suspended sediment concentration.
New information on salt wedges
Our initial flood “snap-shots” from the Mangemangeroa estuary tell us that salt-wedges do develop, even in shallow, largely intertidal estuaries. Thus, we have answered one of our questions about flood sediment dynamics in our relatively infilled estuaries. Our measurements also suggest that the pattern of estuarine sediment dispersal and sedimentation is likely to change as salt-wedges evolve and decay during floods. Furthermore, flood processes, such as the salt-wedge, must be adequately understood and incorporated into models if we are to make useful predictions about the fate of catchment sediments in our estuaries.
Teachers: this article can be used for Biology L7 A.O. 7.3a and NCEA AS 2.5, 2.9 and 3.2. See other curriculum connections at www.niwa.co.nz/pubs/wa/resources
Andrew Swales, John Oldman, John Radford and Iain MacDonald are based at NIWA in Hamilton.
Acknowledgements
We thank the Auckland Regional Council for their generous support of the Mangemangeroa estuary experiment. This research was part of the programme “Effects of Sediments on Estuarine and Coastal ecosytems” (C01X0024) funded by the Foundation for Research, Science and Technology.
