PDF of this article (180 KB)

David Thompson Paul Sagar
Feathers from museum specimens of rockhopper penguins are helping to throw light on the dramatic population decline of this bird in New Zealand’s sub-Antarctic islands since the 1940s.


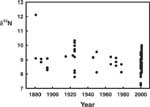
Graph 1: Variation over time in δ15N (‰) for rockhopper penguins from Antipodes Island. Each dot represents an individual bird. Results were similar for the Campbell Island penguins.

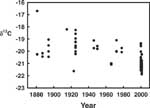
Graph 2: Variation over time in δ13C (‰) for rockhopper penguins from Antipodes Island.

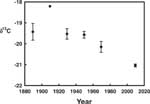
Graph 3: Variation over time in δ13C (‰) for rockhopper penguins from Antipodes Island, data grouped into 20-year means ± 1 standard error.
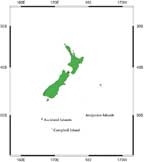
The rockhopper penguin (Eudyptes chrysocome) has a circumantarctic distribution with breeding colonies in the sub-Antarctic zone of all the world’s oceans. In the New Zealand region, rockhopper penguins breed at the Auckland Islands, Antipodes Islands and at Campbell Island.
The International Union for Conservation of Nature and Natural Resources (IUCN) classifies rockhopper penguin as “vulnerable” based on population trends; this translates to “facing a high risk of extinction in the wild in the medium-term future”. (For a complete explanation of the classification used by the IUCN go to www.iucn.org and www.redlist.org).
The situation in New Zealand exemplifies the IUCN’s concern for this species: between 1942 and 1985 the rockhopper penguin population at Campbell Island declined by about 94%, from approximately 1.6 million breeding pairs to just 103,000 pairs. All indications suggest that the decline has continued since the mid 1980s, and has been matched by a similar decline at the Antipodes Islands.
The dramatic reduction in rockhopper penguin numbers at Campbell Island was first reported by Cunningham and Moors in 1994. They suggested that the population crash was most likely a result of changes in the penguins’ diet. Fluctuations in sea temperatures had led to a switch from preferred prey to less appetising, lower quality food, or a reduction in the abundance or availability of their prey. However, these ideas have remained untested, not least because there are neither dietary nor prey abundance data from the pre-decline period to compare with the present. Recent work at NIWA has overcome these problems by using stable isotope analysis of penguin feathers. This novel approach has shed some light on the processes that affect rockhopper penguins in New Zealand’s sub-Antarctic.
Stable isotopes and penguin feathers
Isotopes are versions of the same chemical element that differ only in the number of neutrons in their nuclei. They have the same chemical properties, but often differ in their physical properties. The ratios of stable isotopes of carbon and nitrogen in proteins from an organism provide information about its diet.
- The nitrogen stable isotope ratio provides information about how high up a food chain the organism feeds.
- The carbon isotope ratio provides information about nutrient sources, and also about the productivity of the marine ecosystem: lower carbon ratios indicate less productive systems.
See panel below for further details of isotope analysis and nomenclature.
In the case of rockhopper penguins, isotopic signatures from proteins in feathers reflect dietary information towards the end of the breeding season, immediately prior to feather moult and new feather growth. Three or four small feathers are all that’s required for isotope analysis.
To study long-term trends in penguin diet, we have taken advantage of museum collections around the world, which hold rockhopper penguin specimens collected over the past 120 years. The oldest date from the 1880s. Using this valuable resource we have been able to construct a time-series of feather samples from New Zealand rockhopper penguins from before 1940 (when the population was large) through to the present. We hoped to answer three important questions about long-term trends in rockhopper penguin diets.
- Have their diets changed over the past 100 years?
- If so, was there a change around the 1940s, when the populations in New Zealand began to decline?
- If there is no evidence of a diet change, is there any evidence of a change in the productivity of the sub-Antarctic marine ecosystem over this period?
Have rockhopper penguin diets changed?
The simple answer is “no”. We managed to collect feather samples from contemporary rockhopper penguins breeding at Antipodes Island and Campbell Island, and from over 30 “historical” penguins from Antipodes (1880 to 1980) and from 15 “historical” penguins from Campbell (1904 to 1984). We found no change in the δ15N signature over time (see graph 1). If the diet of rockhopper penguins had changed, we would have expected to see a shift in the nitrogen signature.
So it seems that we can discount the idea that rockhopper penguin numbers have declined because their preferred prey (thought to be small shrimp-like crustaceans, commonly called “krill”) became unavailable, forcing the penguins to switch to a less favourable diet.
Productivity of the marine ecosystem
There still remained the possibility that the amount of available prey had declined. This could have occurred either through a real reduction in the abundance of preferred prey, or through a reduction in the availability of preferred prey – the penguins’ prey may have moved into deeper water, or moved farther away from the islands where penguins breed. Either way, there simply would not be enough food to maintain the breeding birds or raise healthy chicks, or both.
Overall, we found a significant negative relationship between δ13C and year (graph 2), indicating that the carrying capacity of the marine ecosystem has declined. Interestingly, when the δ13C data are grouped into 20-year periods (graph 3), starting with 1880–1899, 1900–1919 and so on, the decline in δ13C (and therefore productivity) appears to occur between the late 1940s and the present. The initial phase of this downward trend coincides with the onset of decline in rockhopper penguin numbers in New Zealand’s sub-Antarctic.
The overall picture then is one of rockhopper penguins maintaining their diet over the relatively long timescale of this study, but being unable to find enough food in a less productive marine ecosystem during recent decades. Whether reduced food results in increases in adult penguin mortality – or in a reduction in chick production or survival – remains to be tested and will be the subject of ongoing research.
Teachers: this article can be used for Biology L8 A.O. 8.1b. See other curriculum connections at www.niwa.co.nz/pubs/wa/resources
David Thompson is based at NIWA in Wellington; Paul Sagar is at NIWA in Christchurch.
Stable isotopes: notation and analysis
Nitrogen and carbon each have two stable isotopes: 14N and 15N, and 12C and 13C. The ratio of the heavier (and less abundant) isotope to the lighter isotope is the value of interest. The relative abundances of stable isotopes are expressed using delta (δ) notation in units of parts per thousand (per mil), and the ratio of stable isotopes in a sample is reported relative to that in an international standard material:
δ (per mil, ‰) = {(R(sample) – R(standard)) / R(standard)} x 1000
where R(sample) is the isotopic ratio of the sample; R(standard) is the isotopic ratio of the relevant international standard
For carbon, the international standard is Pee Dee Belemnite, and for nitrogen is nitrogen from atmospheric air.
All stable isotope analyses in the penguin feather study were performed at NIWA’s stable isotope facility in Wellington, using a fully automated, continuous flow Finnigan MAT DeltaPlus mass spectrometer, coupled to a Carlo-Erba CHN elemental analyser. For further information about this facility, and background information on the use of stable isotope analysis, refer to Water & Atmosphere 7(2): 22–25.
Acknowledgements
This work was funded by the Foundation for Research, Science and Technology (contract no. C01X0039, now C01X0213). We thank the Department of Conservation (DoC) Southland Conservancy for permits to visit Campbell and Antipodes islands and for logistic support, Heritage Expeditions (NZ) Ltd for transport to and from the islands, Kath Walker, Josh Kemp and Chris Rickard (DoC) for help with sample collection, and the collection managers and staff at the following museums for allowing us access to their study skins: Museum of New Zealand Te Papa Tongarewa, Canterbury Museum, American Museum of Natural History, Smithsonian Institute and Naturhistorisches Museum, Vienna.
Further reading
Cunningham, D.M.; Moors, P.J. (1994). The decline of rockhopper penguins Eudyptes chrysocome at Campbell Island, Southern Ocean, and the influence of rising sea temperatures. Emu 94: 27–36.
