The air we breathe is having a profound effect on the way many of us live and die. The statistics are sobering...
What are we breathing?
“… whosoever shall be found guilty of burning coal shall suffer the loss of his head.”
King Edward II, circa 1300 AD
The death-by-air-pollution awaiting some New Zealanders is not as violent as it was for a coal-burning subject of King Edward II. Nevertheless, in urban areas, the air tends to be more heavily laced with a cocktail of toxic elements, the products of emissions from homes, vehicles, and industry. Overall in New Zealand, motor vehicles and domestic wood burners are the two main sources of urban air pollution. Urban areas, of course, are where the majority of us live and work, both causing pollution and suffering from its effects.
The total amount of air pollution, and the relative contribution of different sources of pollutants, varies with the time of year, as these figures from Auckland illustrate:
| season | total PM10 emissions | transport | domestic heating |
|---|---|---|---|
| Winter | 29 tonnes per day | 27% | 64% |
| Summer | 10 tonnes per day | 75% | 2% |
| (PM stands for particulate matter; the number 10 is the size of the particle in microns. You could fit more than 600 PM10 particles on the head of a pin.) | |||
In simple terms, the air pollution story has something of a north/south split. In the South Island, wood burners create high levels of air pollution in winter, and most pollution control efforts are centred on reducing this problem. In the North Island, and Auckland in particular, traffic pollution is often considered the key problem, although wood burners also cause serious pollution problems in winter.
But, even when the urban/rural, north/south, and summer/ winter variables are accounted for, this is only the beginning of the air quality story as it impacts on public health. Who’s most at risk?
Regional and district authorities are responsible for making sure the air we breathe complies with the National Environmental Standard (NES) for air quality established in 2004. In general, the approach local authorities take is to monitor air pollution by use of stationary instruments, such as the trailers positioned by the side of the road at busy intersections. As long as NES standards are not breached, local authorities have met their statutory requirements. At present, their focus is likely to be on reaching the compliance levels set by the Ministry for the Environment before the deadlines of 2016 and 2020 (depending on the region).
Health scientists now know that chronic, lower levels of exposure to pollutants are far more damaging to people’s health than the occasional acute episode when NES standards are breached. In addition, the very young, the elderly, and those who already have respiratory problems are particularly vulnerable, and susceptible to damage from specific types of pollutants.
“Stationary monitoring tells us little about the levels of exposure people are actually subject to in their daily lives,” says Dr Ian Longley, a senior air quality scientist at NIWA in Auckland. “No-one sits at a road junction all day. Most people move between home, school, work, shops, and so on, and breathe different air throughout the day.
“We know very little about New Zealanders’ actual exposure to pollutants – how much of different specific pollutants they encounter each day. This is affected by a huge range of variables – where they live, their lifestyle, the type of traffic on the near by roads, their mode of transport, the way they and their neighbours use their wood burners, as well as things like the weather and where they are at a particular time of day. To figure this out, we have to live and travel with them, and monitor the air in different places at different times of day.”
That’s led scientists at NIWA, the University of Canterbury, and the University of Auckland to develop and use miniaturised and mobile air quality monitoring devices.
In a New Zealand first, Christchurch-based NIWA air quality scientist Jeff Bluett and technician Dave Gibbs developed a car-mounted air-monitoring system. The roof-mounted instruments accurately measure and record levels of PM10, PM2.5, and PM1 particulates and black carbon (soot from sources like diesel exhausts) on the move; at the same time a video camera records passing traffic to improve interpretation of results. Inside the car, computer screens provide instant read-outs of pollutant levels. The system includes a global positioning system (GPS) to simultaneously record the exact location of air quality measurements.
“We can generate maps showing the pollution contours of any road trip or for different parts of the city. We can also produce pollution profiles of travel at different times of day, or in different conditions,” says Mr Bluett.
“Monitoring the air quality inside a vehicle as we travel along using other instruments also produced some valuable results. We were able to show that cars do trap emissions from vehicles in front. The ‘spikes’ in pollutants inside a car when caught behind an accelerating ‘dirty vehicle’ such as a heavy diesel vehicle, are quite astonishing.”
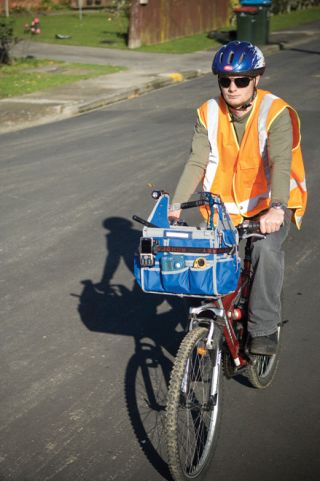
The daily journey to and from work is when many people experience most traffic pollution. NIWA has run various experiments to compare just how much pollution people are exposed to on peak-time journeys by car, cycle, bus, and train in Auckland, and by car, cycle, and bus in Christchurch. People carried some cleverly adapted instruments which monitored air pollution, weather conditions, and location, as well as taking photos along the route.
The results very clearly showed that, although exposures were high for all commuters compared to the rest of their day, the cyclist was the least exposed and the car driver the most, even though they took almost identical routes at the same time of day. In an earlier pilot experiment, exposure to pollutants was highest of all when the commute was made in an old diesel train, the type now being phased out in Auckland in favour of electric trains.
Another challenge for scientists is analysing long-term runs of air-quality data. Local authorities need to know how well mitigation measures they have introduced are working, but it has been very difficult for them to compare air monitoring data from one year or time period to the next, because of the variables that affect the data.
“What happens to emissions can vary every night,” explains Jeff Bluett, “because of varying weather conditions. For example, the night-time temperature, wind speed and direction, and relative humidity can all vary significantly from one night to the next. Also, we might have a relatively warm winter one year and a harsh one the next. This makes it very difficult to compare pollutant concentrations, not just over different nights but also between years.”
NIWA is developing statistical analyses that tease out key meteorological variables from concentration variables, enabling year-on-year comparisons of air quality. Simple spreadsheet-based tools that can be used by regional authority staff will soon be ready.
NIWA is now leading a major eight-year Foundation for Research, Science & Technology-funded ‘Healthy Urban Atmosphere’ research programme, which runs until 2016. Other funders and collaborators include local authorities, the NZ Transport Authority, ministries of Health and Transport, the universities of Auckland and Canterbury, Landcare Research, and Australian researchers working in the same field.
Much of the research will build on the pilot work done by NIWA and its collaborators over the past few years. Projects include looking more closely at indoor exposure to air pollutants, examining the use of wood burners and the pollution they cause, and investigating road dust and sea salt as sources of pollutants. On a larger scale, one project is looking at the emissions footprint of neighbourhoods, and how the way a neighbourhood is designed influences emissions and exposure.
Dr Guy Coulson, research programme leader, summarises the challenges ahead. “This is a fast-moving area of science: new instrumentation and new assessment methods are improving our understanding of pollution concentrations and their health impacts. We’re working out what questions we can and cannot tackle with these new techniques.
“Knowing more about personal exposure will, at the very least, enable us to better inform people who may unwittingly be encountering levels of air pollution that put their health at risk. In the case of vulnerable people, it could make a big difference to their quality of life and life expectancy.” Written by Harriet Palmer, a NIWA science writer.