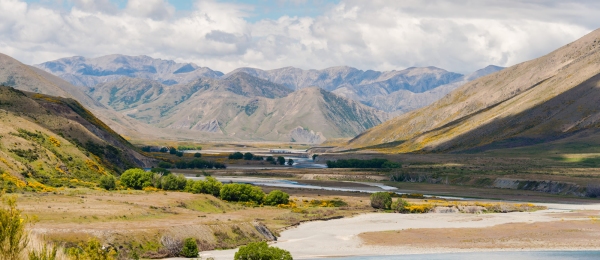
As the road behind Hanmer Springs turns to gravel and a dust cloud forms in the rear vision mirror, the southern edge of Molesworth Station unfolds.
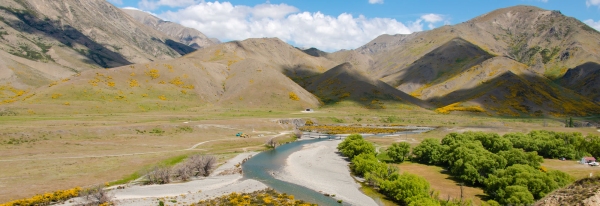
Across Jacks Pass, and down into the Clarence Catchment, bursts of buttery yellow broom in full flower are strewn across foothills; bare brown mountains form a jagged line against the sky, and straight ahead, a river meanders to the horizon.
This 180,787ha station is New Zealand’s largest farm – about the size of Stewart Island – and is administered by the Department of Conversation.
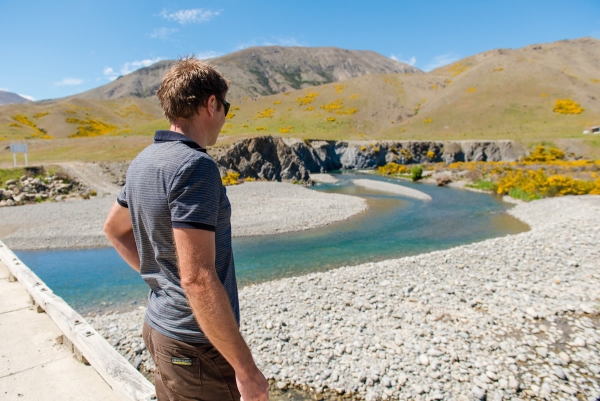
Travelling through Molesworth has been described as “like driving in a painting”. It is full-on stunning but NIWA’s Jeremy Rutherford, an environmental monitoring technician, is more preoccupied with the Clarence River. He leans out of the truck from time to time scanning for a better view of it.
Six weeks ago an unforecasted flood swept through the valley. The river has moved sideways and in places completely changed course, he says.
“A lot of sediment has been picked up and deposited in different spots. But at other places it looks like half a metre of rocks and gravel have been scoured out of the bed.
“It’s not unusual for these rivers to change so dramatically, but it makes it challenging for us.”
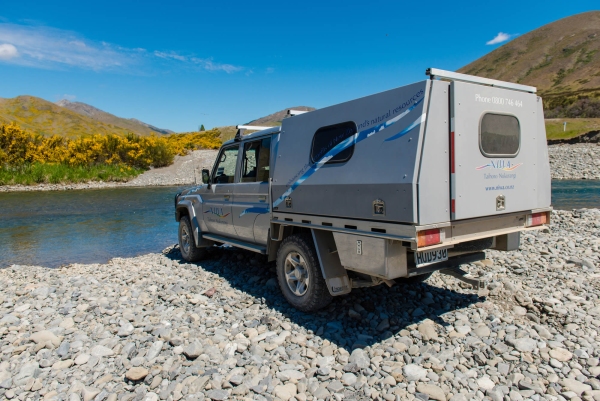
Rutherford is heading further north to the Acheron River to the first of two NIWA river monitoring site stops on Molesworth today. However, the northern abutment of the bridge spanning the Clarence has been washed away – making for what Rutherford describes as “an interesting crossing” which he executes deftly in a sturdy 4WD.
He needs to measure how fast the rivers are flowing, how much water is flowing along them and how high they are. Hydrologists call this measurement the discharge. And they – or their computers – calculate it by multiplying the area of water in a cross section by its average speed. The water level data are fed into a scientific model that estimates the discharge allowing them to monitor flow in real time and continuously.
But when the river changes the models need to be updated with new data and that means more trips more often into the hills for Rutherford and his colleagues.
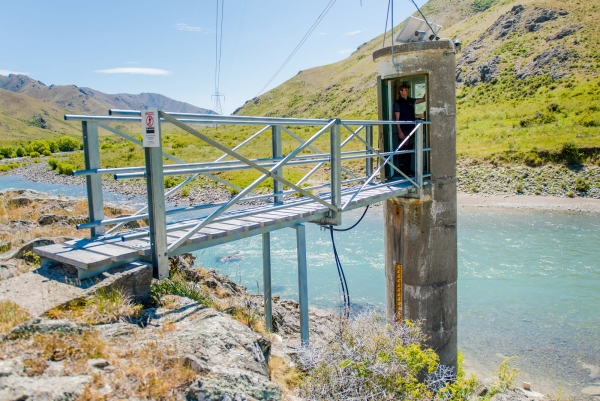
Both Molesworth sites have been recording information since the late 1960s when the former Ministry of Works built large concrete towers connected to the river to measure water levels and flow speeds. These long-term records are immensely valuable.
“The changes we see, they happen over decades. Short term data sets tell us a little bit what happened at a given time, but it doesn’t show us any patterns and it doesn’t show us magnitude,” says Rutherford.
“You need long term records to capture flood events and low flow events so we know when a river really is in low flow, and what the ecological impacts might be.”
The long-term measurements are also used to estimate how much a river could flood by, and therefore how big a road bridge needs to be built, or what size culverts can handle the volume of flood water.
It’s the sort of information regional councils and commercial users need all the time and is routine work for NIWA.
At Molesworth, though, it’s the recreational river users – the kayakers, rafters, fishers, trampers, campers and swimmers - who need it most and access it via a regional council website. Molesworth attracts thousands of visitors a year, its through road even becoming an alternate back country route from Marlborough to Canterbury following the Kaikoura earthquake, until winter when it is closed.
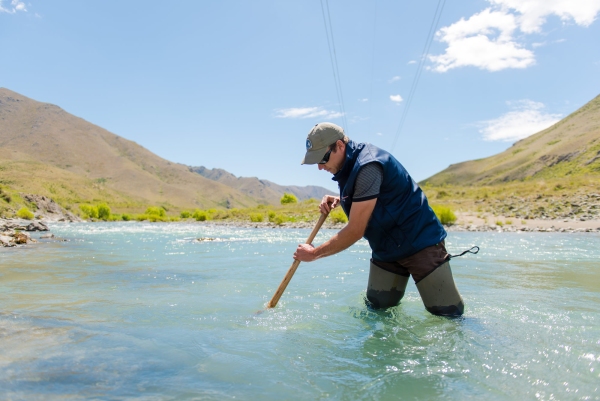
Taking the measurements is a complicated business requiring sophisticated instruments, sensors and a trusty shovel to move a few rocks.
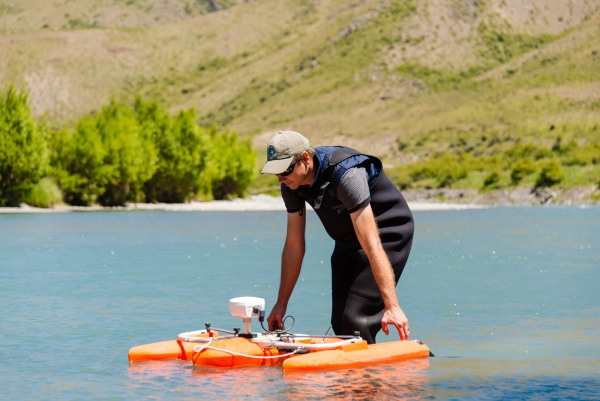
Rutherford unloads what looks like a toy boat from the back of the truck and guides it across four transects of the river. It’s an Acoustic Doppler Current Profiler River Pro, an instrument that floats on the surface of the river shooting acoustic pulses into the water to measure depth and velocity hundreds of times in one crossing.
These measurements build up a picture that enables NIWA to calculate the flow rate and are taken in conjunction with a number of other measurements made inside the concrete tower and from various sensors. These are transmitted by satellite to enable data to be accessed in real time.
On a sunny day the scenery is breathtaking and Rutherford reminds himself not to take it for granted. He has done the same measurements in winter as ice floes charge past him which isn’t so pleasant.
“Look around,” he says, opening his arms. “What a place. It makes my heart sing every time I come here.”
Then he packs up his toy boat, stashes the shovel and drives off back along the dusty road.
Author: Susan Pepperell | Photographer: Hamish McCormick. Summer series 2017

