Autumn and winter rain caused damaging floods and slips across New Zealand, yet again. Susan Pepperell investigates the nation's evolving skill in avoiding and coping with water.
When it rained in March, it really rained. In some places more rain fell in 24 hours than is usual for the whole month. Records tumbled, and then it happened again. And in early April, again.
That’s when the stopbank of the Rangitaiki River breached and flooded the Bay of Plenty town of Edgecumbe.
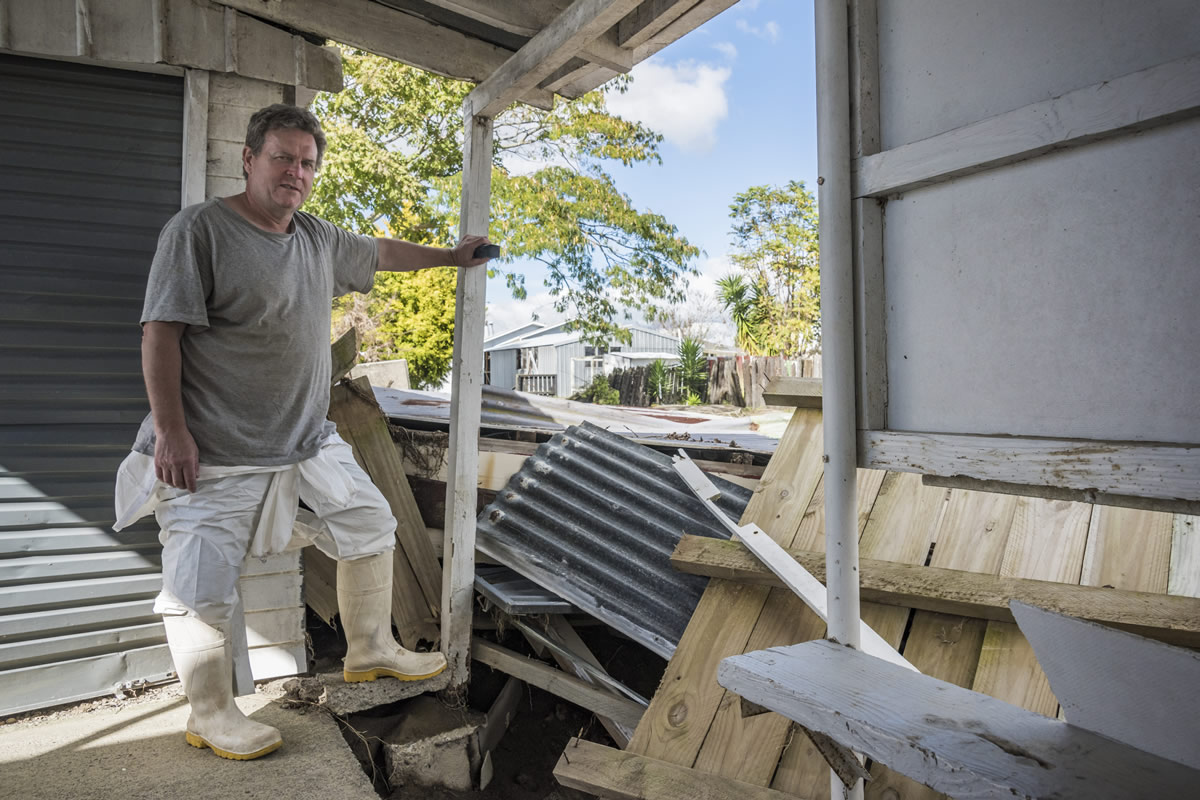
NIWA Hazards Analyst Ryan Paulik was one of a team of researchers who went to Edgecumbe three weeks after the flood occurred and where about 450 buildings were damaged.
“It felt quite strange. There weren’t many residents around; it was pretty deserted – although there were plenty of tradespeople.”
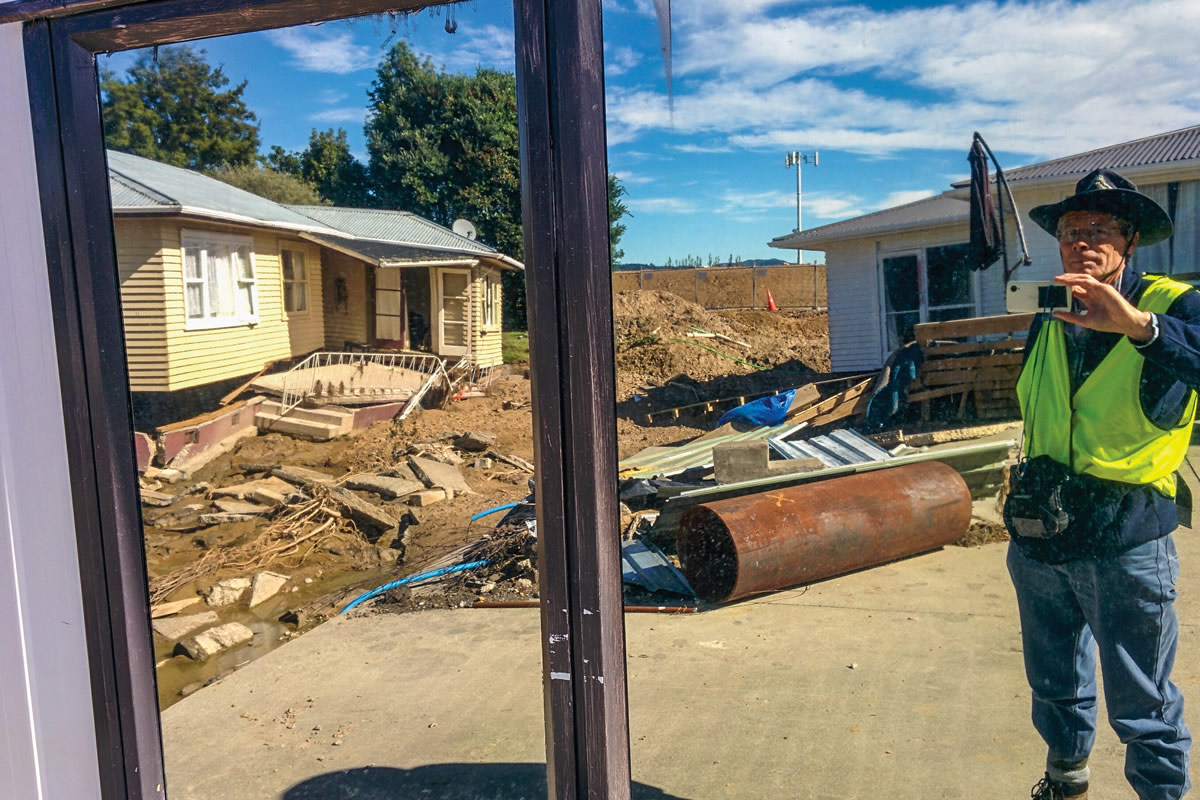
Demolition was in full swing; buildings were being stripped back to the frame. Even partitions were being dismantled, requiring ceiling frames to be propped up.
“A lot of homes had particle board floors which is very absorbent and very brittle so entire floors were having to be removed and replaced. Floods are pretty nasty things,” Mr Paulik said.
The team recorded high water marks on buildings, and details about what each building was made from, how it was constructed and how it was damaged.
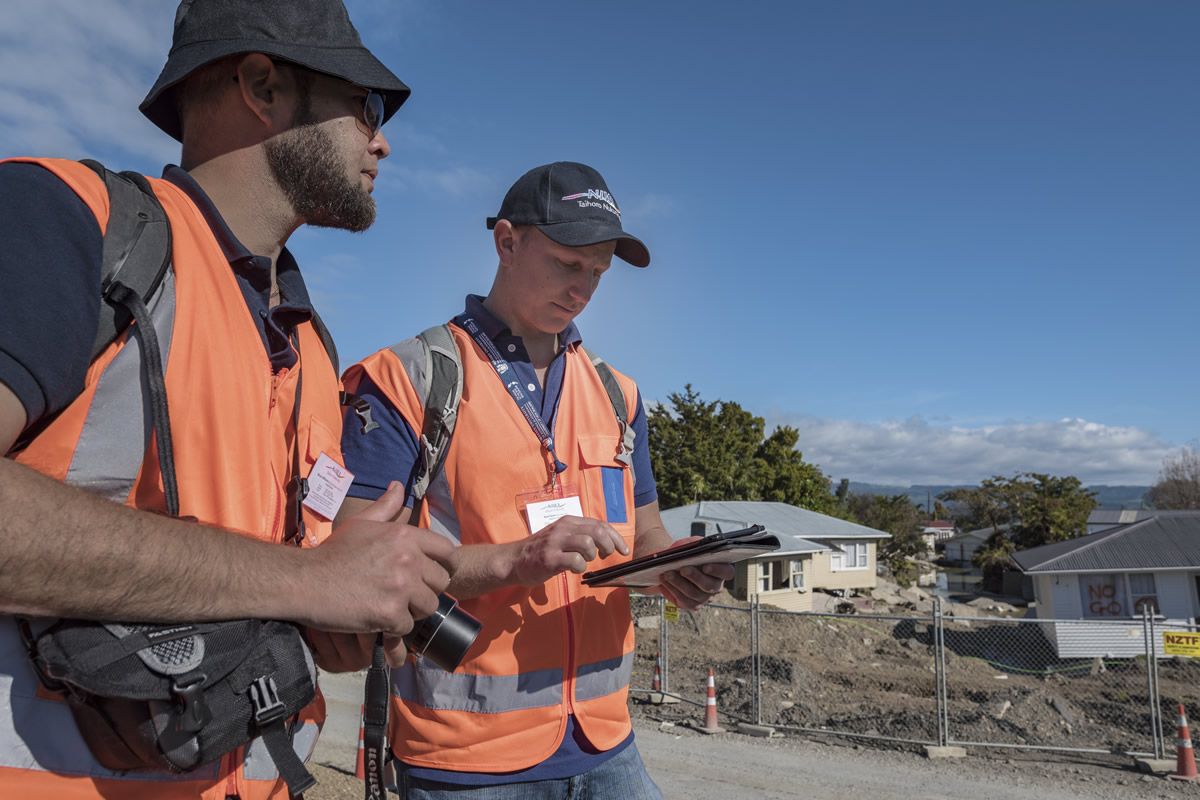
From that information a ‘damage ratio’ is established – a percentage derived from dividing the cost of repairs by the cost to replace. All the information is fed into scientific models that can be used to calculate the damage to similar buildings if they flood in other parts of New Zealand.
Several months on, the next stage for the team is to survey the indirect damage – that’s how much it costs people to be out of their homes while they’re being repaired. The information is a crucial part of assessing the true cost of severe flooding.
As the rebuild progresses, Edgecumbe has joined a long list of New Zealand towns and cities who know how devastating flood damage can be and what it takes to get back to normal.
Whanganui, Northland, Kāpiti Coast, the West Coast, Thames, Lower Hutt … the list is extensive, the damage adding up to billions of dollars.
Whanganui worries
In Manawatu-Whanganui, authorities are only too aware that it’s a matter of time until there’s another major flood.
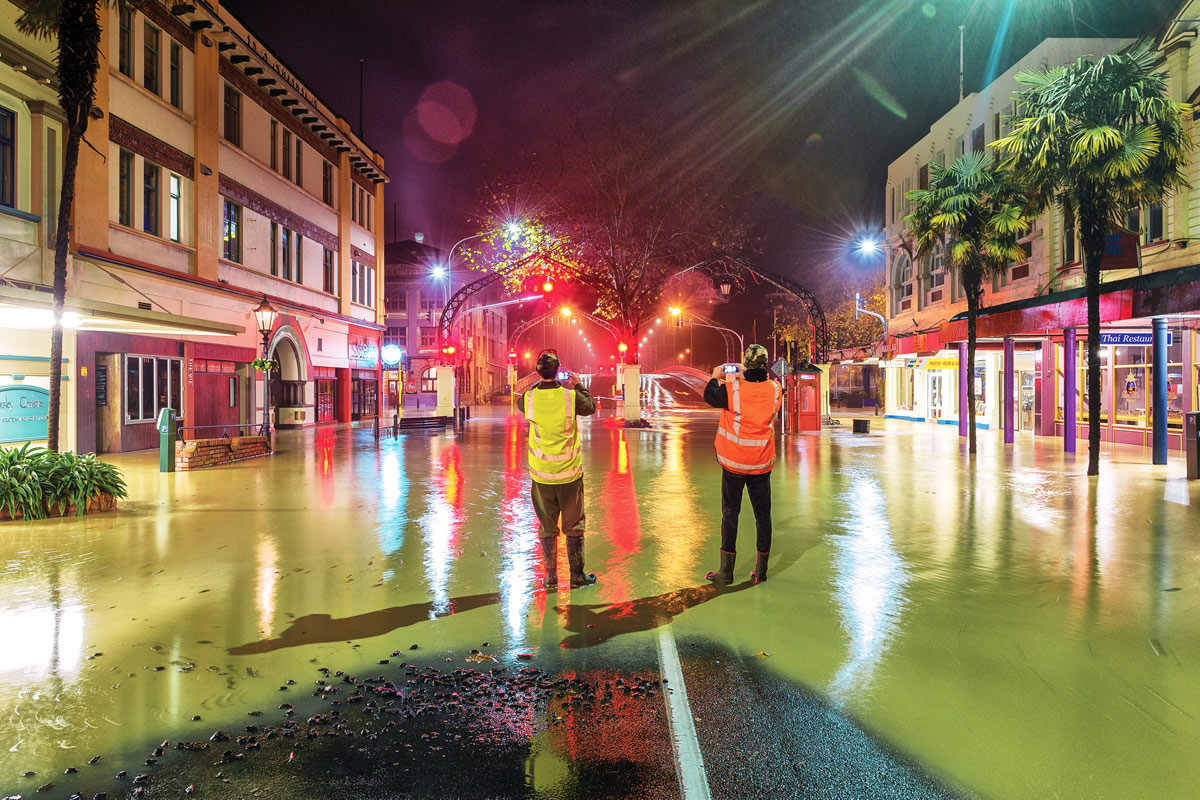
The catchment has been at the epicentre of several significant flood events, notably in June 2015, when a month’s worth of rain fell across the Whanganui region in 24 hours.
The Whanganui River reached its highest ever level, 9.1metres at Town Bridge, at 3am with a flow rate of 5,150 cubicmetres a second. Water spilled into the central business district, and into low-lying residential areas adjoining the river. The city was cut in half by the closure of bridges, and by the end of the weekend, all roads in and out of Whanganui were closed.
In April this year, the city was again on high alert when heavy rain pushed the river level to 7.4 metres. Hundreds were evacuated as residents feared a repeat of the 2015 floods that destroyed homes in the flood zone. Crisis was averted as stop banks held and rainfall eased, but the Horizons Regional Council knows it is only a matter of time until another major flood event plays out again.
Ramon Strong, Horizons Regional Council Group Manager for River Management, said the Edgecumbe floods had brought into sharp relief the need to understand and address flood risks at a local level.
Community engagement around Whanganui’s flood risk – particularly in the high-risk area along Anzac Parade – has been promising. However, the issue is whether higher stop banks provided the best long-term solution for those affected and for the wider community.
Horizons is now looking in more detail at retreat options in flood-prone areas of Anzac Parade. Rather than wholesale acquisition of affected properties, Horizons is looking at a combination of voluntary acquisition and raising some houses in the area following the model adopted in the 1980s for flood-affected properties along the Heathcote River in Christchurch.
“It’s a local issue that needs a local solution and funding, but what helps is having understanding from the community, central government and the insurance industry,” said Mr Strong. “There is a long-term gain here.”
NIWA modelling of rainfall patterns and flood risk in the Whanganui catchment has shown that flood frequency will change over time.
“Risk is still the underlying challenge to address,” Mr Strong said.
When the rain didn't stop
In July, risk of flooding became reality in parts of the South Island. Oamaru recorded its wettest day in history since records began in 1950 when more than four times the normal July rainfall came down in just 24 hours. By the end of July it had already experienced its wettest winter on record with a month of the season to come.
Then parts of Dunedin flooded, closely followed by the area next to the Heathcote River as it overflowed.
By the end of July, Wellington had recorded 228mm of rain for the month – or 166 per cent of normal. Slips blocked roads and threatened homes all over the city. Last year the total rainfall for July in Wellington was 68mm.
For Greater Wellington, Otago, parts of Canterbury, Nelson and large parts of the North Island, July rainfall was well above normal. Several extreme weather events drove the record figures, especially for coastal areas from Christchurch south to Balclutha.
Water everywhere
The frequency of flooding in New Zealand, and predictions that it may happen more often as the climate changes, is why NIWA views development of accurate flood forecast tools as a priority. The development of tools involves several complex steps.
The first is to use atmospheric models to predict where and how much it’s going to rain. The second is to use hydrological models – NIWA uses a system called TopNet – to translate that information into river and stream flows. This plots how much rain will make its way into the waterways and at what speed it will travel.
From there, it’s the turn of the hydrodynamic model. This is a sophisticated computational process that predicts flood plain inundation and the damage that will be caused from the amount and speed of the water.
Another programme, a joint venture between NIWA and GNS Science called RiskScape, is a tool for analysing potential economic and human impacts and losses from natural hazards. It can predict building damage and replacement costs following a flood, as well as human casualties, economic losses, business disruption and the number of people who could be displaced.
Flood modelling is complex and incredibly sensitive to the topography of an area. Weather forecasters seeking to predict the likely path of a tropical cyclone, for instance, face trying to pinpoint where rainfall will occur across what is essentially a very narrow strip of land in the midst of a vast ocean. Small differences make a significant impact.
For flood inundation models, a road or embankment that isn’t included can mean the difference between a full-scale flood and a narrow miss.
Accurate topography mapping is crucial and the best way to get that is by LiDAR which stands for Light Detection and Ranging, and is a remote sensing method that uses light in the form of a pulsed laser.
And while most councils have some form of flood prediction system in place, reducing the risk further will require considerable investment.
Graeme Smart, NIWA Principal Scientist of Natural Hazards, says long-term losses from flooding are greater than that of earthquakes but with earthquakes the threat may be more dramatic.
“Flooding is not seen as such a severe threat but it is far more debilitating.
“With enough investment we will get better at reducing our exposure to future floods. Practical steps are possible to reduce community vulnerability but the bottom line is that there needs to be a collective willingness to invest.”
Warming in Wellington
Wellington city will have warmer autumns, almost a month of days over 25°C and up to 10 per cent more winter rain by 2090.
It’s the climate change scenario that looks like good news at first glance if you’re a Wellingtonian, but NIWA’s Climate Change Report for Wellington Region includes some startling projections.
The report was commissioned by the Greater Wellington Regional Council and shows significant warming that means more droughts, pressure on water supply, fewer frosts and more heat waves.
The report takes into account inherent uncertainty in climate projections due to likely fluctuations in future greenhouse gas emissions. Findings for the Wellington region:
- Autumn is the season likely to warm the most.
- Annual temperatures will increase by 1°C by 2040 and up to 3°C by 2090.
- Frosts in the high elevations of the Tararua Ranges are likely to disappear.
- Spring rainfall will reduce by up to 15% in eastern areas by 2090.
- There will be up to 15% more winter rainfall along the west coast by 2090.
- The risk of drought will increase in the Wairarapa.
- There will be more extreme rainfall events.
[This feature appeared in Water & Atmosphere 19]