PDF of this article (486 KB)


Ashmita Gosai and Jim Salinger and their research partners have combined hospital admissions and climate data to tease out the connections.
The influence of weather and climate on human health is an important issue for hospitals and health agencies in New Zealand. Recent studies have shown there’s a seasonal cycle to hospital admissions and mortality (deaths), and in Auckland they tend to increase during the winter. Despite the logic of these findings, little is known about the relationship between climate and the health of different age groups. Recently, we conducted a study with the University of Auckland and the Auckland District Health Board. Our principal aim was to investigate the effects of climate on health in the Auckland area, with a focus on respiratory infections. Understanding these effects is vital for developing strategies for improving community health.
Auckland’s climate
Auckland enjoys a ‘warm temperate’ climate with well defined seasons. Mean temperatures range between 19 °C in January/February and 11 °C in July. The highest recorded temperature is 30 °C and the lowest is 0 °C; ground frosts are infrequent. Rainfall ranges from a summer minimum of 70 mm in February to a winter maximum of 130 mm in July. Winds are predominantly southwest, with a secondary maximum from the northeast.
Auckland’s population
Over a third of New Zealand’s four million people live in Auckland, the largest urban area in the country. The majority (92%) are under 70 years old. Sixty-two percent of the population is classified as New Zealand European, and the other main groups are Maori (9%), Pacific Islanders (12%), and Asians (13%). In particular, more Pacific Islanders live in the lower income areas of South Auckland, where they make up a third of the population. Auckland’s lower income populations are known to suffer reduced life expectancies and substandard housing; these are likely to relate directly to health and the environment.
Climate and health in Auckland
In the first part of the study, we reviewed climate and health in the Auckland area. We charted hospital admissions and deaths over six years and compared these with climate and daily weather data for the same period. This showed that mortality in Auckland is strongly related to the changing seasons, but does not necessarily reflect daily weather changes.
We found deaths from respiratory and cardiovascular illnesses and from sudden infant death syndrome were highest in July–September (mid winter to early spring), and lowest in February–March (late summer to early autumn). Admissions to Middlemore Hospital in South Auckland for respiratory and cardiac conditions peaked in winter and were strongly linked with threshold mean temperatures. Once the mean temperature fell below a 10 °C threshold for several days, hospital admissions increased sharply.
We also found a strong connection between the weather and meningococcal diseases. The incidence of disease increased with higher humidity or rainfall and decreased as mean temperatures rose.
Climate and respiratory disease in Auckland
The second part of our research linked climate-sensitive illness and diseases more closely to temperature. We examined the relationship between minimum, maximum, and mean temperatures and respiratory diseases, particularly bronchiolitis (a respiratory infection that affects the tiny airways), whooping cough, and other respiratory infections and inflammations. The New Zealand Health Information System provided daily admissions data related to respiratory diseases for the Auckland region, which comprises four district health boards: Auckland, Waitemata, Manukau, and Middlemore. Climate information came from NIWA’s National Climate Database.
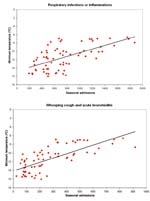
About 40% of the rise in hospital admissions for respiratory infections and inflammations in winter are linked to minimum temperature; that is, admissions increase as temperature falls. And 53% of the rise in admissions in winter for whooping cough and acute bronchiolitis can be explained by minimum temperature. The graphs above show that as minimum temperatures decrease the number of admissions to Auckland hospitals increase.
Effects on the young and the old
When we looked at different age categories, we found a higher incidence of whooping cough and acute bronchiolitis in the 0–14 year olds. Respiratory infections and inflammations were highest in the age groups of 0–10 years old and 65+; the youngest and the oldest are more susceptible to cold temperatures.
Our initial results suggest that the elderly, infants, and people with impaired mobility or cardiovascular disease are disproportionately affected by climate extremes. This may be a due to their bodies’ limited ability to adjust to temperature changes. Conversely, healthy people can cope with sudden changes in temperature. Climate sensitivity also tends to vary with ethnicity and socio–economic status. The communities most vulnerable to climate fluctuations are low–income households; they may be at greater risk due to substandard housing conditions, inadequate heating, and general poor health.
The findings from these studies show a relationship between climate conditions and illness, disease, and mortality in the Auckland region. Future study will focus on using this information and modelling to improve hospital planning for management of personnel and hospital capacity. The development of clear relationships between climate variability, age categories, and health indicators can help guide the prevention and control of such diseases in New Zealand’s largest urban centre.
Nothing to sneeze at
- Climate and weather data have been compared with hospital admission figures for the Auckland area over a six-year period.
- Low temperatures and high rainfall/humidity correspond with increased admissions for respiratory, cardiovascular, and meningococcal diseases, with children and the elderly the worst affected.
- Climate variability studies can help authorities develop strategies for community health plans and for hospital staffing and capacity.
Ashmita Gosai and Dr Jim Salinger both work at NIWA in Auckland in climate and energy applications. Their partners in this research were Dr Virginia Hope, health researcher and advisor at the Auckland Regional Public Health Service, Dr Kim Dirks, who lectures on physiology at the University of Auckland, and Julie Harris, admissions manager at Auckland Hospital.
Teachers’ resource for NCEA Achievement Standards or Unit Standards: Biology Level 1 AS90178, US6295 Science Level 3 US18981 See other curriculum connections at www.niwa.co.nz/pubs/wa/resources
