PDF of this article (156 KB)

Melissa Bowen Ken Richardson Matt Pinkerton Aarno Korpela Michael Uddstrom
Computer analysis of satellite data is giving us new insight into how the ocean moves around New Zealand.
Pictures of the surface of the ocean taken by satellites often show beautiful swirls, curls, and plumes. When the pictures are animated, the features can appear to be slowly moving. Some of this apparent movement reflects underlying currents pulling the features along. With the help of computer analysis, a sequence of images can be used to estimate the surface ocean currents.
How are velocities calculated?
In the early days of satellite imagery, features were tracked from image to image by hand. Not only was this process time consuming, the results varied depending on who did the tracking. As computers have become more powerful, automated techniques have been developed to derive the velocity of underlying currents using a variety of different methods.

One of the simplest methods uses a computer program to match patterns in an image with patterns in the next image by computing cross correlations. The program selects a small square in the first image and then searches over an area in the second image around the location of the square in the first image. The search area covers at least the maximum distance the currents are expected to have moved the features in the time between the images. At each position in the search area the cross correlation is computed between the square from the first image and the same-sized piece in the second image. The location that produces the maximum cross correlation is the most likely match between the two images. The speed is then the distance between the original location in the first image and the location of the maximum cross correlation in the second image divided by the time between the images. The process is repeated for other pieces of the image to find velocities at as many places as possible.
We put a number of quality controls on the velocities. First, the velocities are rejected if the match between the patterns is poor by choosing a minimum acceptable value for the maximum cross correlation. We can also require the vectors to have certain properties, for instance, having coherence in space. Even with these types of controls a few “rogue” vectors still make it through. Averaging the velocities in space and time can reduce the influence of these noisy measurements.
What does the method produce?

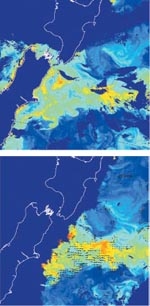
Features can be tracked in all kinds of imagery as long as there are some features, and some portions of the images are cloud-free. Detailed thermal and colour patterns are almost always found where subtropical and subantarctic waters meet between the Chatham Islands and the east coast of the South Island. These patterns can be seen in high-resolution thermal and colour images received at NIWA from satellites passing over the region. The first image (right) shows an estimate of chlorophyll derived from satellite measurements of visible wavelengths. Velocities derived from tracking patterns between this image and a second image received a day later show strong flows along the southern side of the Rise running from west to east with a speed of about 20 centimetres per second, or nearly half a knot.
The velocities determined by this method are one way of looking at the surface ocean currents and have several advantages over surface currents estimated in other ways. First, the velocities contain all components of flow that contribute to the total surface currents, including the directly wind-driven currents, the geostrophic flow (that is, the flow driven by pressure and the earth’s rotation), and the tides. Usually these components are estimated separately from other satellite measurements, models, and historic shipboard observations, and added together. The feature-tracking method can also provide more detailed information on the velocity structure in the flow than most other estimates. Since velocities are extracted best where there are strong features, such as the extensive phytoplankton blooms along the Chatham Rise, vectors are often produced in useful places.
There are also some disadvantages to the feature-tracking method. The velocities are patchy in space and time: it is therefore not possible to guarantee a velocity at a certain location and time. In addition, there are always a number of noisy velocities.
Future studies
Velocities can be extracted from historical archives of imagery to find currents over recent decades, but the numbers of images and the time required to prepare them are prohibitively large. Another approach is to automatically extract velocities on a real-time basis as the imagery is collected. As the velocities are collected and archived, we could gradually learn more about the nature of the circulation around New Zealand from these new observations.
Melissa Bowen, Ken Richardson, Matt Pinkerton, Aarno Korpela, and Michael Uddstrom are all based at NIWA in Wellington.
Teachers’ resource for NCEA AS: Science 2.2; Physics 1.2, 2.7; Geography 1.7, 2.7, 3.1, 3.7. See other curriculum connections at www.niwa.co.nz/pubs/wa/resources
The authors would like to thank the SeaWiFS Project (Code 970.2) and the Distributed Active Archive Center (Code 902) at the Goddard Space Flight Center, USA, for the production and distribution of these data. These activities are sponsored by NASA’s “Mission to Planet Earth” programme.
