PDF of this article (304 KB)

Murray Hicks Richard Westaway Stuart Lane
An experiment on the Waimakariri River has shown that remote sensing techniques could become very useful tools for estimating gravel movement.
How much gravel from the riverbed – or bedload – do rivers transport during floods? Engineers and managers are interested in this for several reasons. First of all, knowledge of the gravel load is required to manage riverbed levels, so that, for example, the bed doesn’t build up and increase the risk of flood flows spilling out of the channel. For a more long-term view, planners also need to know how proposed changes in the river flow regime – such as “flood harvesting” (where flood waters are diverted into irrigation reservoirs) – would affect gravel transport, since, for example, a reduced gravel supply to the coast can accelerate coastal erosion.
But measuring rates of bedload transport in a river is not always straightforward, especially in the large, braided, gravel-bed rivers of the South Island. NIWA’s Sediment Processes Group, in collaboration with UK researchers at the Universities of Leeds and Cambridge, have been experimenting with remote-sensing technologies for estimating gravel transport rates in Canterbury’s large braided rivers. They have come up with a promising method for making reasonably accurate estimates over short periods.
The morphological method
The morphological method for estimating bedload transport uses measurements of changes in the shape – or morphology – of the river channel over time to estimate average rates of movement of bed material. When applied to braided rivers, the approach assumes that bedload transport occurs mainly in discrete slugs of bed material, rather than all over the channel. Bed movement might occur, for example, when the bank of a gravel bar collapses, or when material is scoured out where flows from two channels come together. Gravel is usually deposited only a short distance downstream where the flow can no longer sustain the transport.
To estimate bedload transport rates, repeat surveys are carried out along a reach of riverbed at suitable times, such as before and after a flood. A comparison of the surveys allows us to estimate how much material has been eroded and deposited. We then estimate the average distance the bedload moves, known as the “step length”. There are several ways of doing this, including measuring the typical spacing between adjacent areas of erosion and deposition, or by measuring how far cobbles marked with brightly coloured paint or miniature radio transmitters are carried by a flood.
Direct measurement of the rate of bedload transport, using a special bedload sampler, would clearly present enormous practical and safety problems in the large Canterbury rivers. During a flood, these may be over 2 km wide with water velocities far too fast for wading or safe boating. This means that before-and-after surveys are really the only practical way of obtaining a field-based estimate of bedload transport in these rivers.
Surveying erosion and deposition

For the morphological method to be successful, our surveys of the river bed need to be very accurate. In the past this has been done by making measurements across many transects of the river – an extremely time-consuming procedure.
These days, the relatively new technology of remote sensing offers a possible alternative. We have tried this out on a 3-km-long by 1-km-wide experimental reach of the Waimakariri River, just north of Christchurch, to acquire high- resolution digital elevation models (DEMs) of the riverbed at times between floods when the river is low and most of the bed is exposed. We carried out the measurements using two techniques: digital photogrammetry (digitising high-resolution aerial photographs) and aerial laser scanning (remotely sensing the shape of the riverbed from an aircraft). To obtain the same quality of data, we found that the cost of photogrammetry generally increased in proportion to area of riverbed surveyed, while the per-area cost of laser scanning decreased as the survey area increased.
The river channels that still held water at low flows were surveyed directly with a small dinghy equipped with an echo-sounder and GPS navigation. Alternatively, water depth was mapped by calibration of the water colour on aerial photographs with actual depth measurements.
DEMs of difference: maps of erosion and deposition

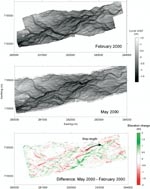
The figure shows two grey-scale DEMs of the Waimakariri River test reach. The first was surveyed in February 2000 using digital photogrammetry and the second three months later (using aerial laser scanning), after the passage of a bank-to-bank flood that had a peak flow rate of 840 m3/s. Lighter areas are higher, and heights are measured from the base of the riverbed, which is sloping. Each DEM pixel represents one square metre of riverbed, and there are over 3 million pixels in each DEM.
The coloured plot underneath was obtained by subtracting the February DEM from the May DEM. Thus, on this “DEM of difference” green indicates where gravel was deposited, and red shows areas that were eroded. Notice that the main changes are in the central belt of braiding channels, with little change on the higher areas of riverbed. Greatest erosion depths were in places where channels migrated sideways as braid banks eroded, while the highest deposits occurred where channels were filled in by advancing gravel lobes. We were able to observe these processes during this flood with time-lapse video.
Estimating gravel movement
To estimate the total amounts of bedload eroded and deposited over the whole reach in that single flood, we added up all the changes greater than the margin of error for the data (which we analysed separately). These amounted to 265,000 m3 eroded and 340,000 m3 deposited, suggesting an average gravel volume mobilised of 101 m3 per metre along the 3-km reach. The average step-length between adjacent centres of erosion and deposition was estimated as 790 m. (See arrow on the DEM of difference for an example.) Thus the average transfer of gravel past a cross-section between the two surveys was 101 x 790 ≈ 80,000 m3. Using the same approach and comparing the February 2000 survey with one done in February 1999, we estimated an annual bedload transport of 109,000 m3.
These estimates are likely to be minimum transport volumes, since the morphological method assumes that the gravel moves only one step-length between successive surveys and is not turned over more than once during a flood event. Clearly, such assumptions are less likely to hold as the interval between surveys increases or during a very large, prolonged flood.
Nonetheless, the above estimate of gravel transport between February 1999 and February 2000 is reasonably consistent with a long-term average annual bedload transport rate of approximately 275,000 m3/yr at the study reach that was determined in 1989 from analysis of historical cross-sections and gravel-extraction data. Because the floods in 1999 were relatively small, we expected lower-than-average bedload movement. We conclude that this reach-scale morphological approach can provide a reasonable, minimum-value estimate of bedload transport over individual floods and probably over periods of up to a year.
Murray Hicks is based at NIWA in Christchurch; Richard Westaway is a consultant with Halcrow Water in Swindon, UK; Stuart Lane is Professor of Geography at the University of Leeds, UK. For further information, contact Murray Hicks ([email protected]).
Real-time and time-lapse imagery of the Waimakariri study site.
Further reading
Westaway, R.M.; Lane, S.N.; Hicks, D.M. (2003). Remote survey of large-scale braided rivers using digital photogrammetry and image analysis. International Journal of Remote Sensing 24: 795–815.
Carson, M.A.; Griffiths, G.A. (1989). Gravel transport in the braided Waimakariri River: mechanisms, measurements and predictions. Journal of Hydrology 109: 201–220.
Acknowledgements
This study was partly supported by the Foundation for Research, Science and Technology under Contract C01X0014. Environment Canterbury assisted with ground surveys. AAM Geoscan conducted the aerial laser scanning.
