Do good land management practices in dairy areas improve water quality and associated invertebrate communities?
Take our quick Freshwater and Estuaries Update reader survey
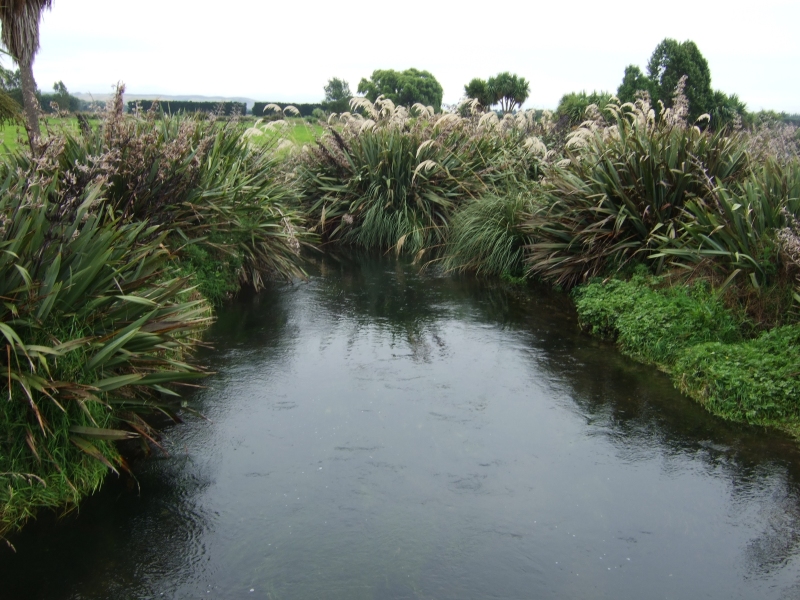
The Good Management Practices (GMP) project was set up in 2001 in response to increasing pressure on the dairy industry to maintain - or preferably improve – its environmental performance. The project’s aim is to integrate environmentally-sustainable behaviour into dairy farming (Photo 1) as the industry works to increase the productivity of farms.
More specifically, it aims to develop and/or implement land management practices which will result in acceptable, catchment-specific water quality standards. Adoption of these practices has been voluntary and progressive.
Results from five monitored catchments located in Waikato, Taranaki, Canterbury, Southland and West Coast show, over a ten-year period:
- some improvements in water quality due to more fencing and an increase in spraying effluent over land as a way to dispose of the effluent (Table 1)
- water quality indicators included phosphorus, clarity, suspended solids and E. coli
- a general increase in nitrogen concentrations as dairy farming continues to intensify
- only modest improvements in macroinvertebrate biotic indices and stream habitat.
Most indices showed no change over this period, despite the improvements in land use practices (Table 2). However, nitrogen concentration was strongly associated with invertebrate changes through time at three of the five sites. We were able to show this using statistical analysis of invertebrate community structure – the numbers and types of taxa - and individual water quality variables. Flow, water temperature, pH and suspended solids were other important water quality variables at different locations.
In summary, the adoption of GMPs significantly improved water clarity, suspended solids and E. coli, but nitrogen trends were variable against a background of increasing inputs and production.
Invertebrate responses were generally neutral. Some invertebrate species are seen as “sensitive”, and their presence is used as an indicator for water quality. However, their absence may also mean a lack of connectivity (so the sensitive species couldn’t reach the waterways in question) rather than indicating its quality.
The neutral ecological response may also reflect lags in the development of riparian vegetation and shade. Significant improvements to the biological health of many streams could take more than ten years, and require more GMPs.
Table 1: ten-year trends in water quality variables at each of the GMP project sites. Stream fencing was a key environmental management tool associated with improvements in water quality. Here, we present the increase in streams fenced over a ten-year period, as well as the overall final proportion of streams fenced upstream of the sites. TN = total nitrogen, NOX-N = nitrate + nitrite, FRP = filterable reactive phosphorus, SS = suspended solids. [Aslan Wright-Stow]
|
Site |
|
Bog Burn |
Waikakahi |
Waiokura |
Toenepi |
Inchbonnie |
|---|---|---|---|---|---|---|
|
Water quality
|
TN |
↑ |
↑ |
↓ |
- |
↓ |
|
NOX-N |
↑ |
↑ |
↓ |
- |
↓ |
|
|
FRP |
- |
- |
- |
- |
↓ |
|
|
TP |
- |
- |
- |
- |
↓ |
|
|
E. coli |
↑ |
↓ |
↓ |
- |
- |
|
|
SS |
↓ |
↓ |
↓ |
↓ |
↓ |
|
|
Black disc |
- |
↑ |
↑ |
↑ |
↑ |
|
|
Environmental management |
Proportion of stream fenced |
+40% (>80%) |
+18% (96%) |
+42% (>80%) |
+74% (>80%) |
+40% (>80%) |
Table 2: trends for macroinvertebrate community metrics at sites with long-term summer sampling. “Upper”, “middle” and “lower” refer to sampling locations in each catchment. ↑ = improvements, “-“ = no detectable change. MCI = Macroinvertebrate Community Index, QMCI = Quantitative Macroinvertebrate Community Index, %EPT = percent contribution of Ephemeroptera, Trichoptera and Plecoptera invertebrates to total abundance. ND = no data. [Aslan Wright-Stow]
|
Metric |
MCI |
QMCI |
%EPT |
TR |
|---|---|---|---|---|
|
Bog Burn |
No Data |
ND |
ND |
ND |
|
Waikakahi Upper |
- |
- |
- |
- |
|
Middle |
- |
- |
- |
- |
|
Lower |
- |
↑ |
↑ |
- |
|
Waiokura Upper |
↑ |
- |
↑ |
- |
|
Middle |
↑ |
- |
- |
- |
|
Lower |
- |
- |
- |
- |
|
Toenepi Middle |
- |
- |
- |
↑ |
|
Inchbonnie |
ND |
ND |
ND |
ND |
Go back to Freshwater Update 68

