11 November 2015
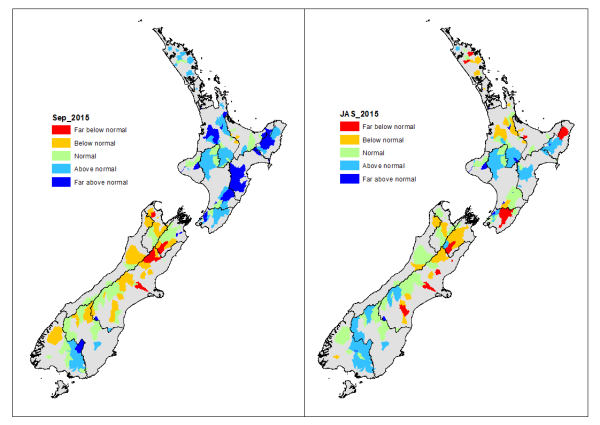
The third quarter flow map shows a distinct contrast between the wet west and south of New Zealand and the dry north and east.
By September however many South Island rivers had receded to normal or below, while the North Island remained or became wetter than normal.
View the river flow maps below. Click on the image to make it bigger.

