NIWA
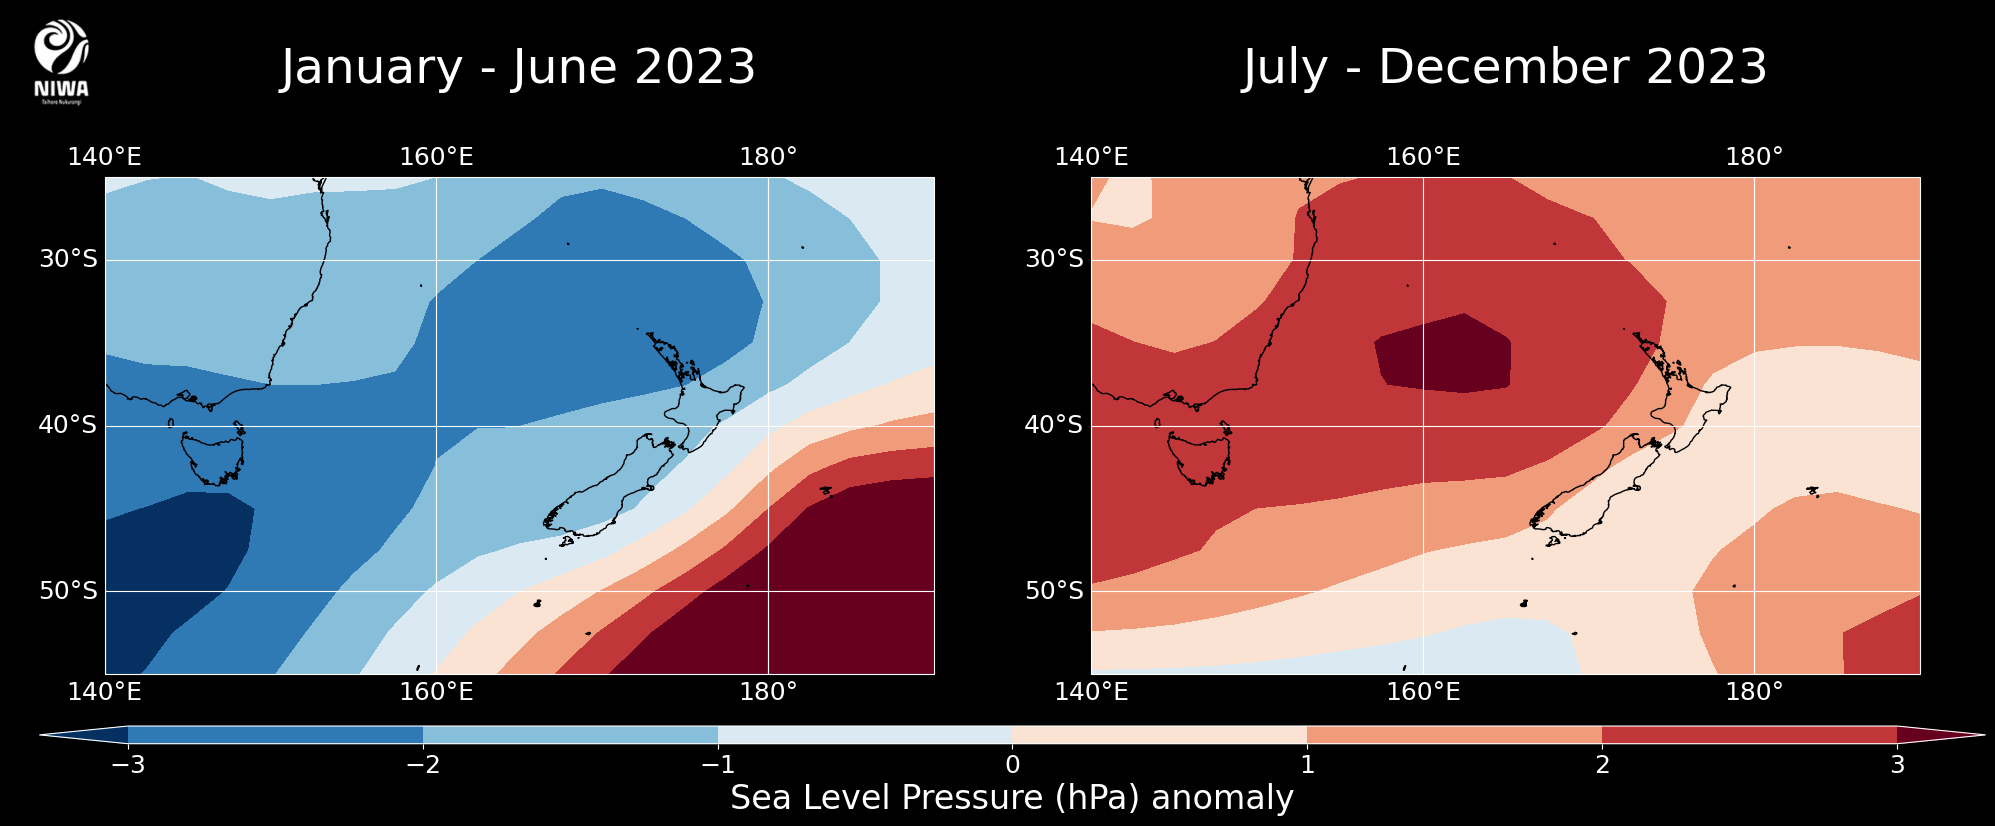
Figure 3: (a, left) Sea level pressure anomalies during the first six months of the year (January – June 2023). Blue shows lower than normal pressure, and red showers higher than normal pressures. (b, right) Sea level pressures during the last six months of the year (July – December 2023). Anomalies are the difference from the 1991-2020 baseline period. Data from NCEP reanalysis (accessed January 2024). [NIWA]