NIWA
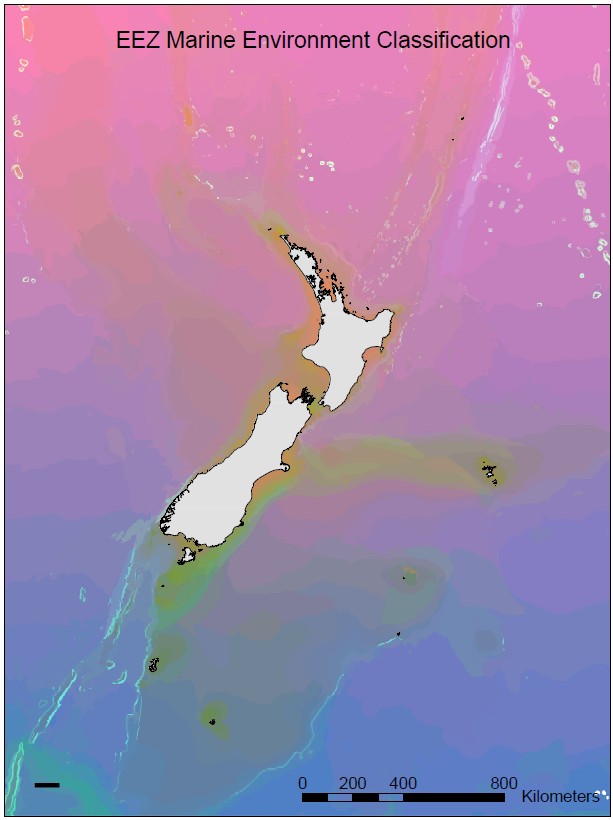
Map of the most detailed
level (290 classes) of the MEC for the
New Zealand region using a
continuous color scheme. Blue shades
represent areas that are deeper and
have lower tidal current and lower
mean orbital velocity. Red shades
indicate areas having high values of
wintertime SST and annual mean
surface solar radiation. Green shades
indicate areas with higher seabed
slopes, areas of high SST gradient, and
to a lesser extent, strong tidal currents.
Gray lines = 1000- and 2000-meter
isobaths.