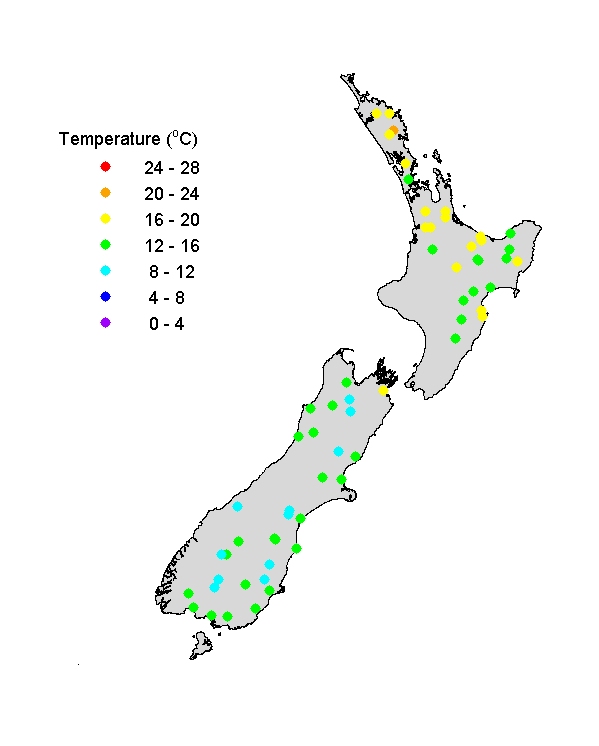
River water temperatures (October, November, December)
Take our quick Freshwater and Estuaries Update reader survey
Note: data is missing for: Wellington and Taranaki regions where NRWQN sites have been closed)
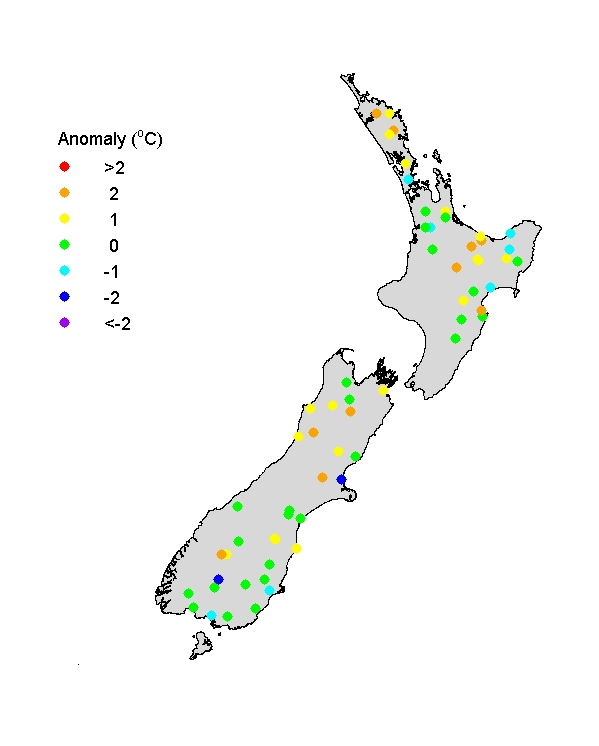
Spring 2015 river water temperatures were mostly in the range 8-16oC in South Island and a little warmer (up to 20oC) in northern North Island. The usual weak trends of increasing temperature moving north (increasingly latitude) and a more definite trend of decreasing temperature with increasing altitude of catchments are present. The temperature anomaly map shows that river temperatures were fairly typical for spring in a majority of NZ rivers, but unusually warm (up to 2oC) in numerous rivers throughout the country. Temperatures were, however, unusually cool owing to seasonal snow melt in two large alpine rivers.
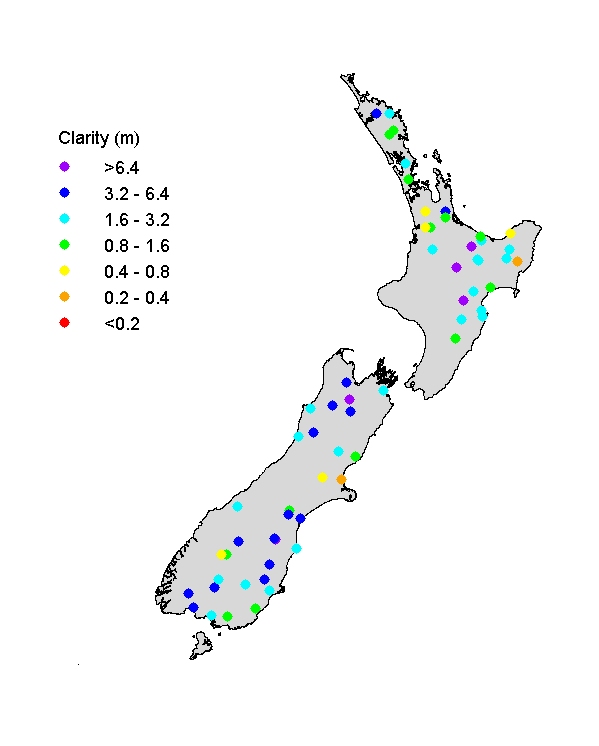
Visual clarity of rivers(October, November, December)
Note: data is missing for: Wellington and Taranaki regions where NRWQN sites have been closed)
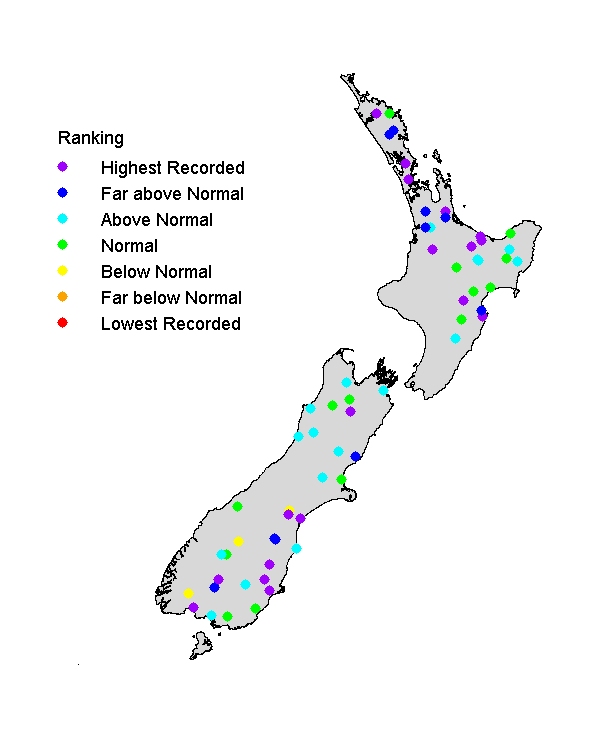
Visual clarity of rivers through spring 2015 ranged widely (from <0.4m to >6 m) across New Zealand, reflecting the diversity of soil and rock types, vegetation cover, and flow state. (Rivers draining clay soils and/or weak rocks tend to be turbid, particularly under livestock pasture; while rivers are generally clearer under low flow conditions.) The visual clarity ranking map shows that many rivers were unusually clear for spring, particularly in northern NI and south-eastern South island, probably reflecting lower than typical flows.