On this page:
- Why is it important to monitor our changing climate?
- How do we monitor the climate?
- What are some of the tools climate scientists use to monitor climate?
- Activity – show your stripes
- Quiz – understanding past climate can help predict the future
Download a shorter version of this lesson in PowerPoint or as a PDF or continue below to see the lesson in full.
You might be surprised to hear that scientists study the past to try and predict the future. But if we can understand how the Earth’s climate has changed in the past, we can use that information to understand how it might change in the future.
In this lesson, we’re going to learn about the importance of monitoring climate change, the tools scientists use to monitor the climate and how observations are used to predict the future.
Why is it important to monitor our changing climate?
The earth’s climate has been changing naturally for billions of years.
But at the beginning of the Industrial Revolution in the 18th century, humans started to release large amounts of greenhouse gases into the atmosphere, causing the earth’s climate to warm and change.
This has greatly accelerated natural atmospheric processes (not caused by human activities) that cause the climate to change.
Ongoing monitoring of the climate is essential – we need to have good, accurate scientific observations to best understand climate change and prepare for the future.
How do we monitor the climate?
For decades, scientists have used climate and weather stations to record atmospheric and weather conditions like temperature, rainfall, humidity and wind. They take accurate measurements that help us understand year to year climate variability and long-term trends. But, how do scientists know what the climate was doing thousands or even millions of years ago?
There are natural environmental clues that we can study to understand the past climate – ice cores and tree rings are two examples. These natural recorders are like puzzle pieces of the past – scientists piece them together to understand what the climate might have been like way back then.
So, how does all this information help us predict what future climate might be like? Scientists create powerful computer models and simulations that include information about our past climate and estimate how the climate might change in the future. The next lesson will teach you more about computer models.
Carbon dioxide
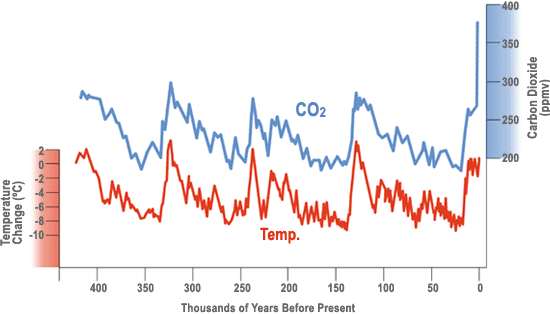
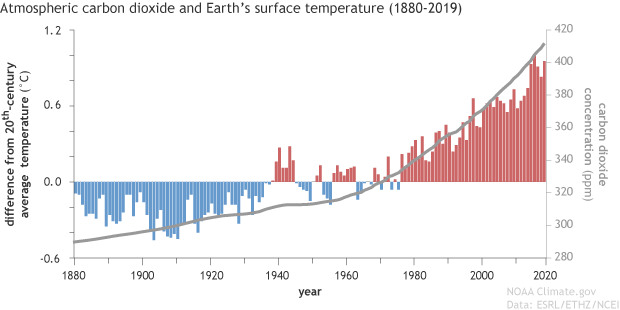
Carbon dioxide is a helpful gas to look at when we talk about climate change. For millions of years, there has been a close relationship between the amount of carbon dioxide in the atmosphere and the earth’s temperature. The graph below shows how carbon dioxide and temperature have gone up and down together over the past 400,000 years.
However, there has been a dramatic increase in carbon dioxide over the past 250 years primarily due to the burning of fossil fuels by humans, which means that temperature is going to keep increasing too.
What are some of the tools climate scientists use to monitor climate?
Now , we’re going to look at some of the tools that scientists use to monitor the climate.
NIWA’s seven-station temperature series
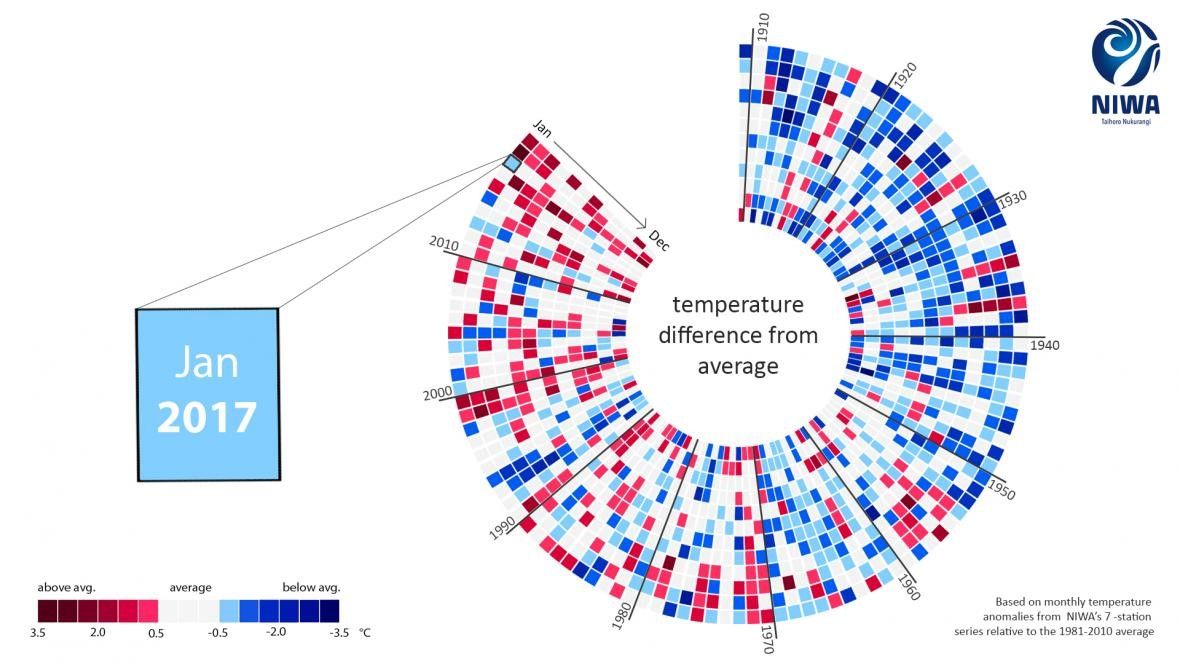
In New Zealand, NIWA’s seven-station temperature series helps us understand how our national average temperatures have changed over a long period of time. These climate stations, in seven locations around the country, collect important data which helps us understand temperature trends. The stations are in Auckland, Wellington, Masterton, Nelson, Hokitika, Lincoln, and Dunedin, and have been operating since 1909.
The below ’climate donut’ graph was created with data from the seven-station series. Designed in January 2020, the graph shows that since 1909, New Zealand is having more frequent months with warmer or ‘above average’ temperatures. In fact, the last time we had a cooler than average month was January 2017.
Weather stations
As well as these seven stations, NIWA has a network of over 200 weather stations across the country, and shares data with the public through the National Climate Database, MetService and other partners, who have at least another 200 stations. All together, New Zealand’s network of monitoring stations give us an accurate picture of what’s happening with our weather and climate – from the mountains to the sea. Some of New Zealand’s oldest weather stations have records going back to the 1850s – how cool is that!
Written and oral records
Written and oral records made by humans in the past can also be used to understand past climates.
For example, in the past, sailors at sea all over the world kept detailed logbooks of atmospheric conditions to help them with navigation and to understand what weather conditions might be coming over the next few days – there were no weather forecasts in those days. NIWA has been using these old records from sailors to reconstruct different past climates. This is particularly important for building up a longer historic climate record in the Southern Hemisphere where there is a lot of ocean with no climate stations in place!
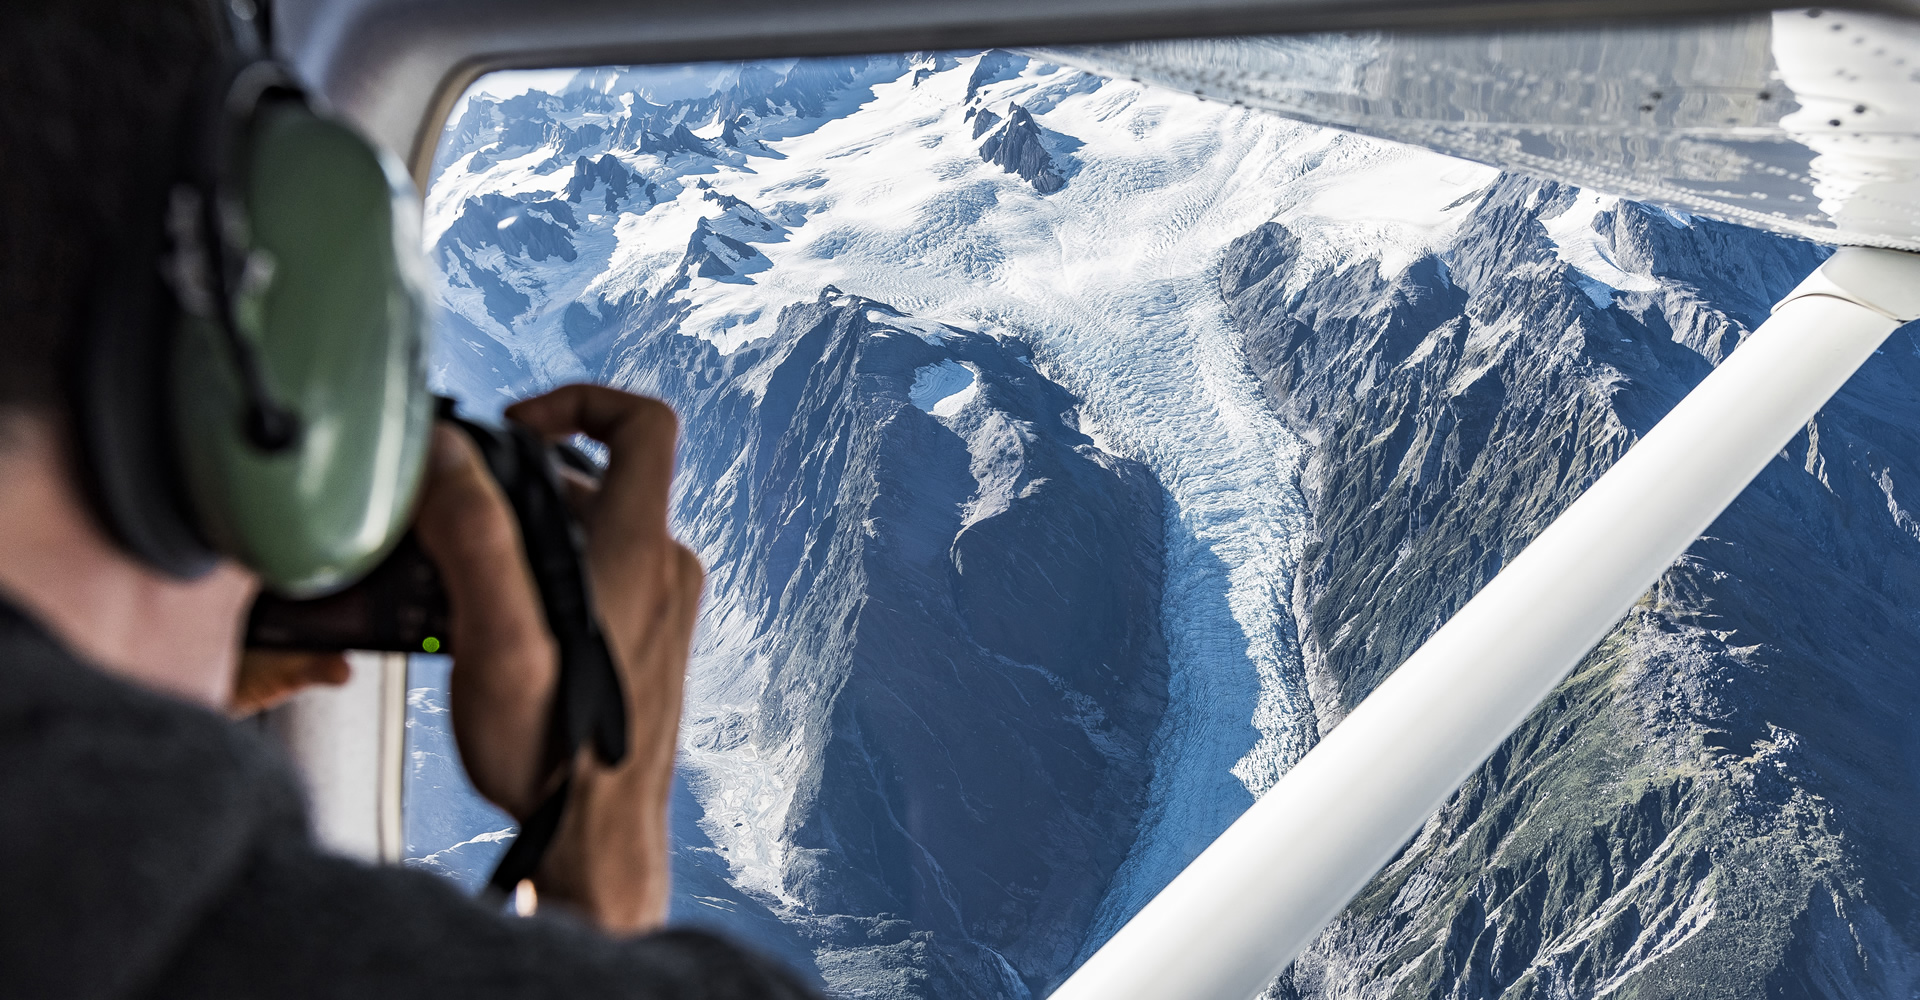
Glaciers
A glacier is like a large river of ice that responds to a changing climate. When the climate is cooling, glaciers increase in size and advance further downhill as more snow and ice accumulates. When the climate is warming, glaciers tend to melt and decrease in size, causing them to retreat uphill. Scientists can study these movements of glaciers, as well as the markers they leave on the landscape as they retreat (such as piles of rock called moraines), to understand changes in our climate.
Glaciers in the Southern Alps of the South Island are estimated to have lost more than 30% of their volume over the last 40 years.
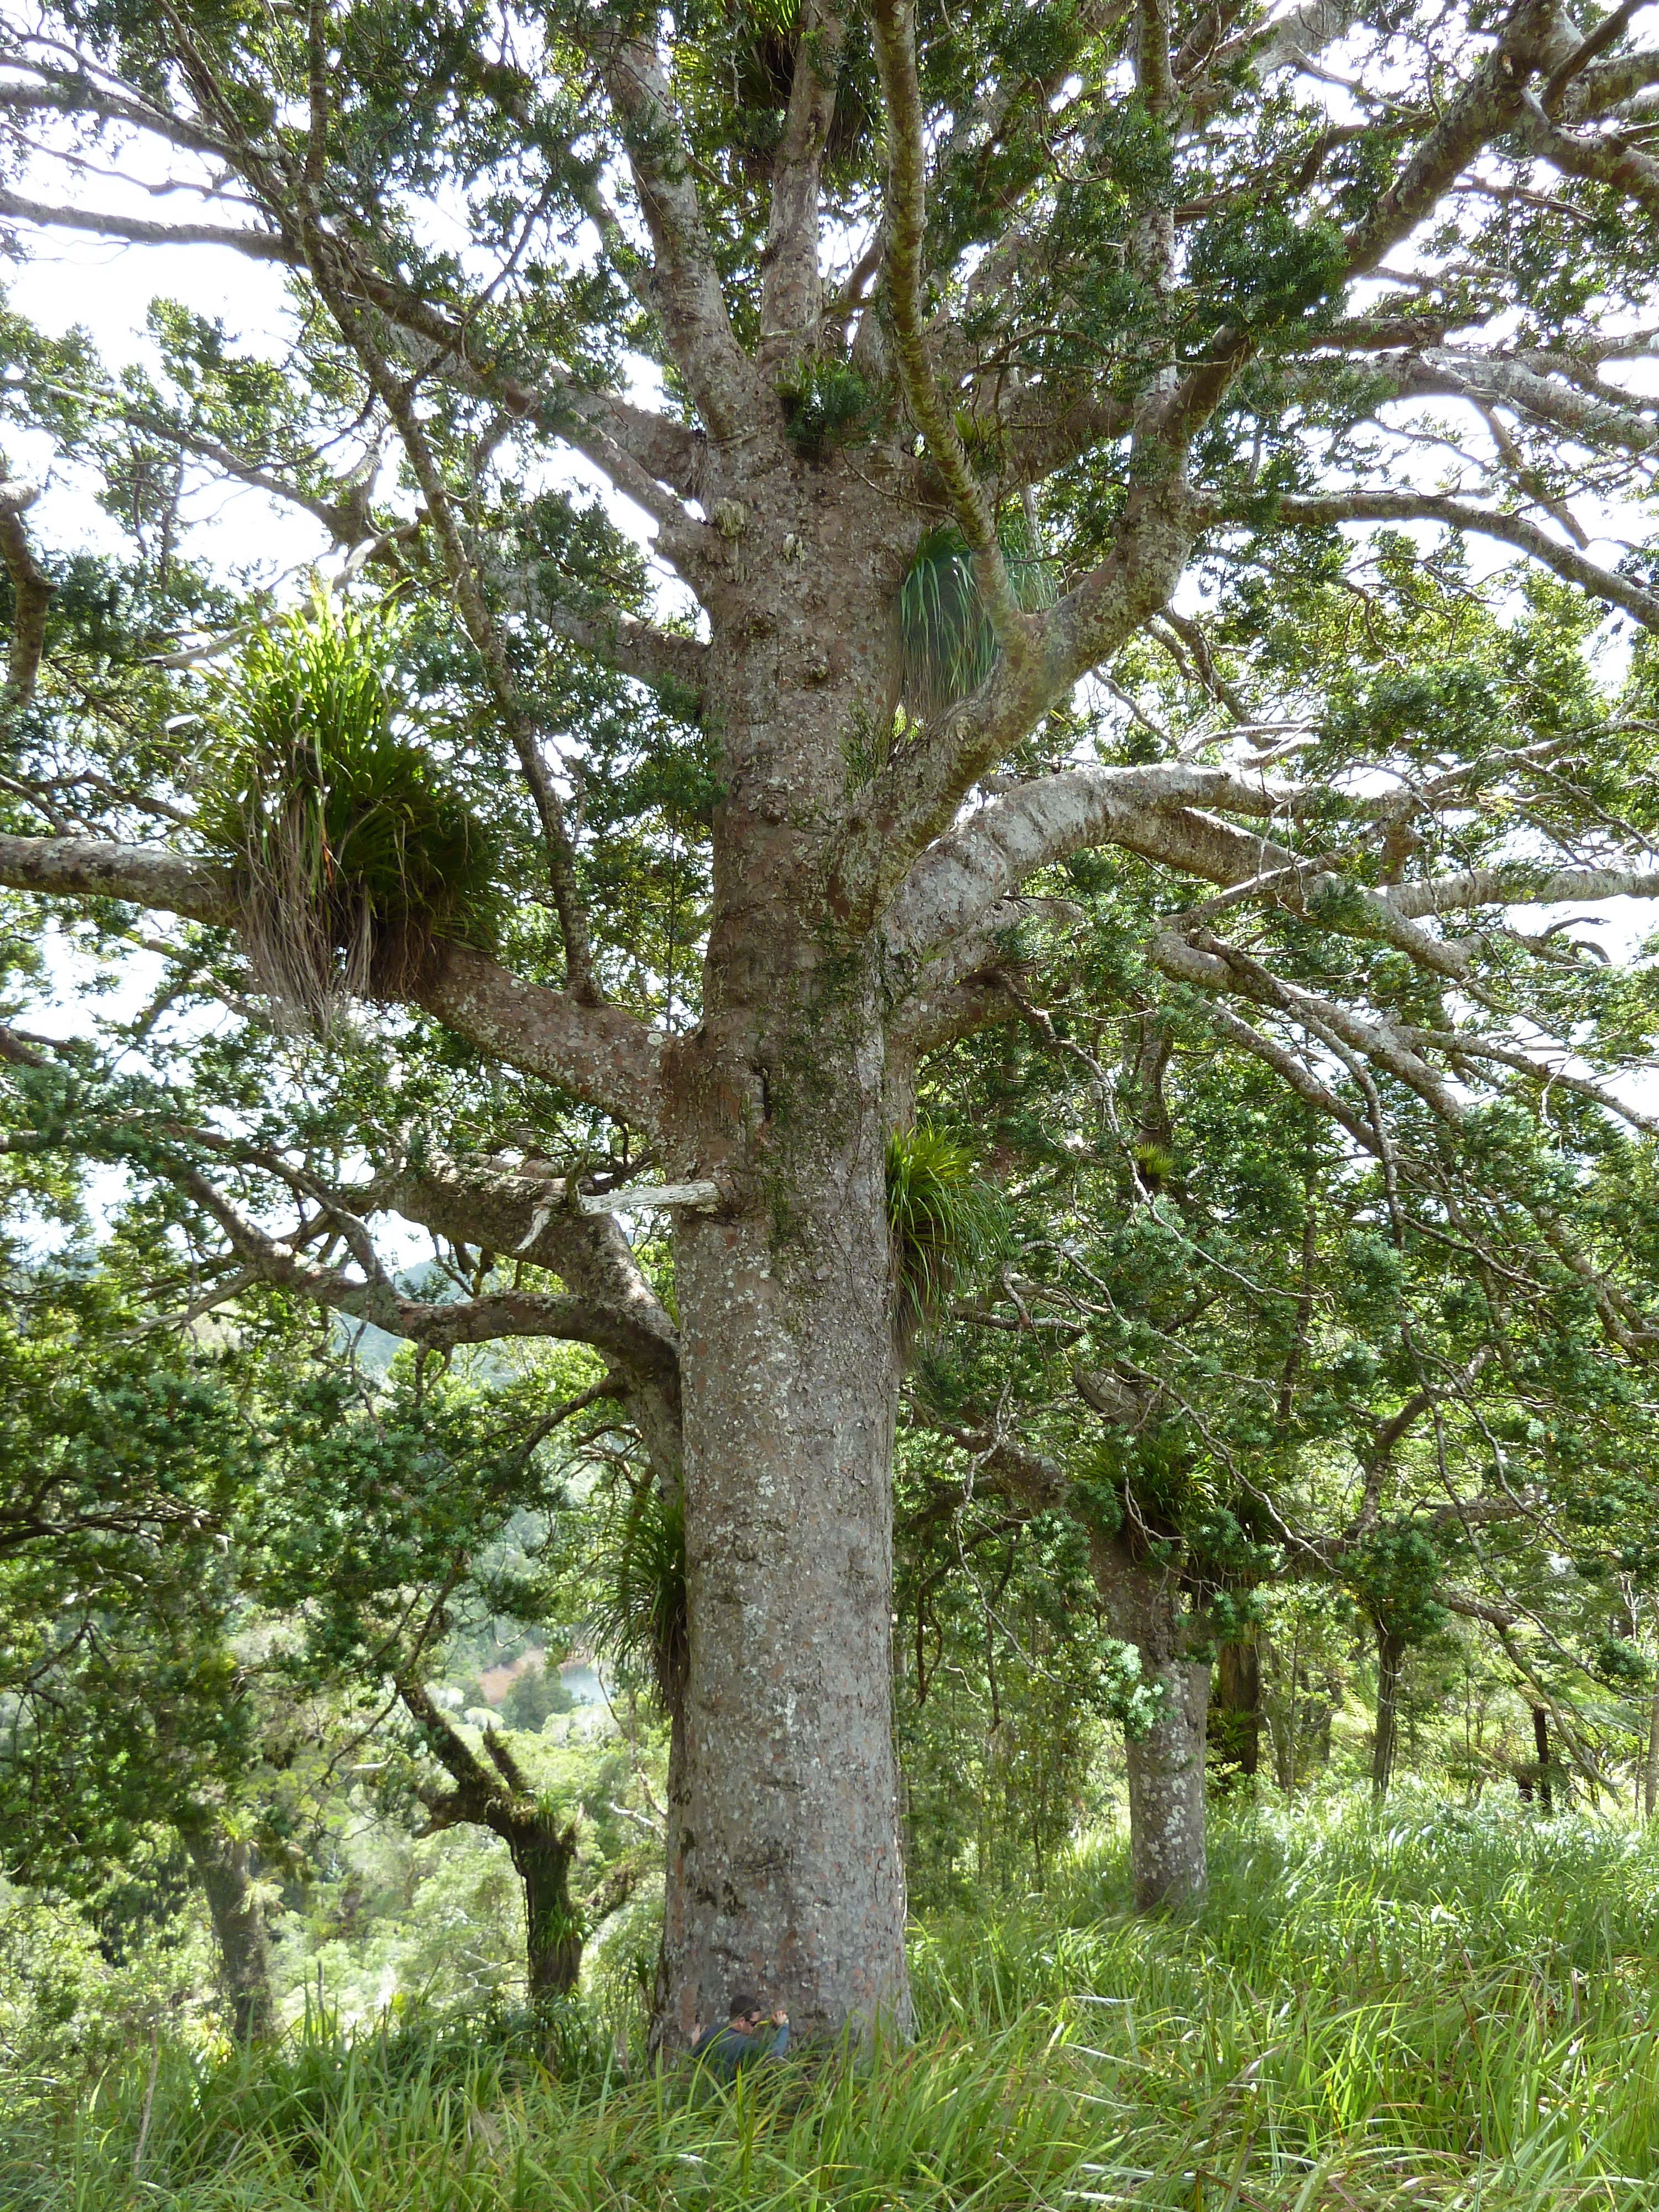
Tree rings
Studying growth rings in a tree can tell us how old a tree is, and sometimes what the climate was like during each year of its life.
The width of a tree ring may depend on environmental factors such as temperature, rainfall and soil moisture. Scientists can use this information to reconstruct past climates.
The Kauri tree, which only grows in northern New Zealand, is one of the best tree species in the world for doing this kind of research as they live for a very long time and sometimes have over 1000 rings!
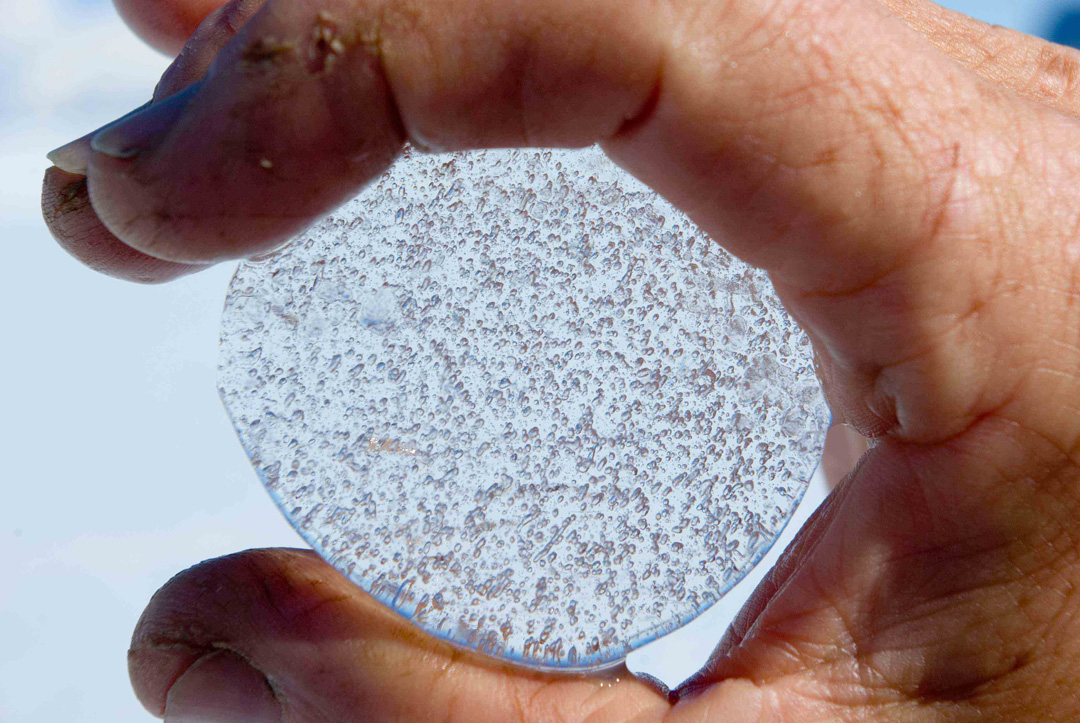
Ice cores
An ice core is a sample of ice taken from a sheet of ice or from a glacier. Scientists use ice cores to understand the temperature and the amounts of different greenhouse gases in the atmosphere at the time the snow fell and froze to become ice. Ice cores can be really helpful because they can help us understand past climates hundreds of thousands of years ago.
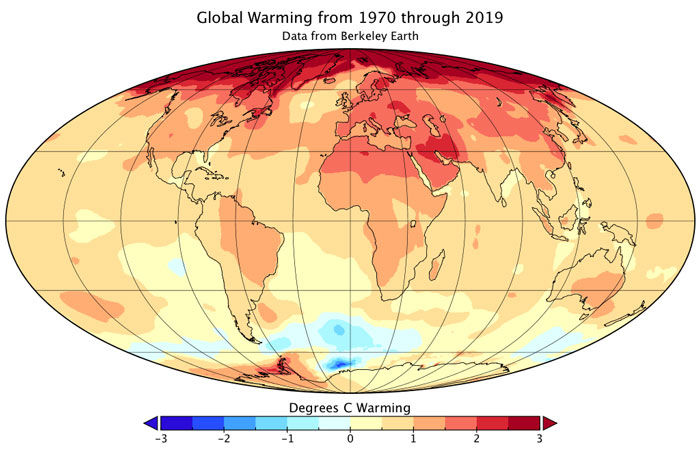
Activity – show your stripes
Show Your Stripes is a website that creates a visualisation showing how the climate has changed in different parts of the world. The website uses long-term temperature data collected from around the world and the colour of each stripe represents the temperature of a year. The cooler years are white and blue and the warmer years are orange and red.
What you’ll need:
A computer with access to the internet. Go to https://showyourstripes.info/.
Instructions:
- Divide the class into small groups (2-3 students per group).
- Assign a different region to each group and ask the students to download a Climate Stripes image for a country in their assigned region.
- Ask the students to discuss in their groups what the visualisation is showing.
- As a class, discuss the similarities and differences for different regions of the world and why there are differences
Explanation:
While every region shows a warming trend, there are differences in each region. This is because climates vary all around the world and are changing at different rates and in different ways.
Quiz – understanding past climate can help predict the future
Check out our climate quiz. The quiz works best on Kahoot, but if you prefer a text version, you can download it as a PDF.
