Forecasting sea surface temperatures several months in advance is challenging. To give us insights into what might happen around Aotearoa New Zealand in the months to come, NIWA scientists have combined predictions from eight different climate models from institutes around the world.
Amid a changing climate, global sea surface temperatures are increasing. This will be associated with more frequent and intense marine heatwave events, which are defined as as being an extended period of extremely warm ocean temperatures that can extend up to thousands of kilometres. In late November and early December 2021, a marine heatwave developed around the North Island. By the end of the year, it reached record levels in the northern North Island and at least matched the previous record event of 2017-18 in the east and west of the North Island. By early January 2022, it had expanded into the north and east of the South Island.
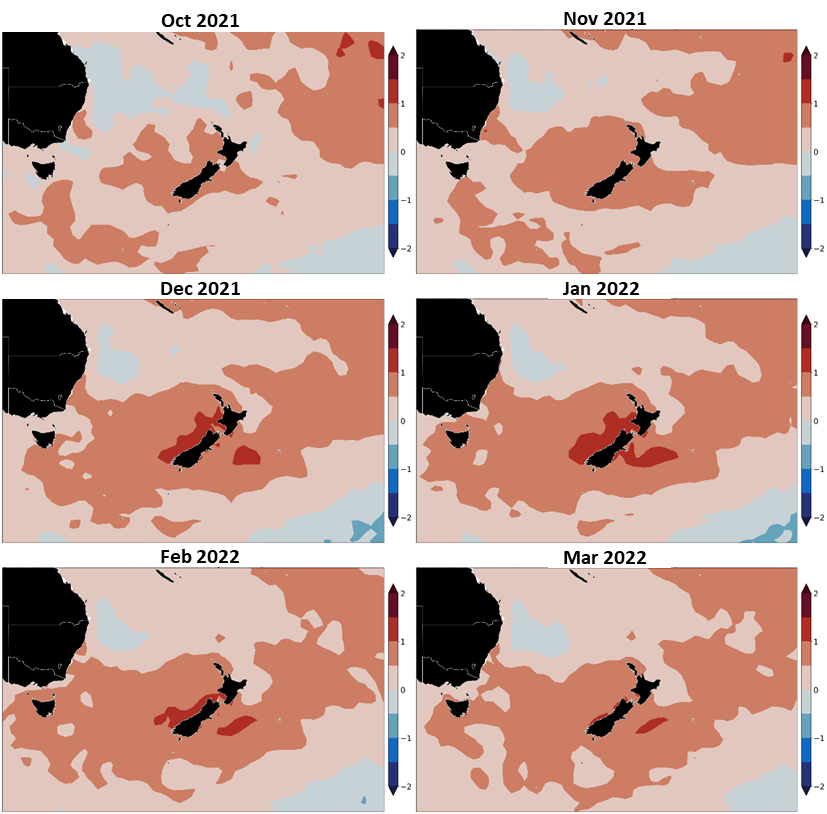
The images below, which are updated once a month, provide an indication on the possible sea surface temperature conditions over the coming months.
NIWA’s forecasting models
The current forecasting computer models have a low resolution of about 110 x 110km, which means they cover large areas such as the Cook strait but not places like the Sounds.
“Pelorus Sound is where half of Aotearoa New Zealand’s aquaculture occurs, so it is a very important area to include in our forecasts”, says NIWA hydrodynamics scientist David Plew. “What we do know from the current models is that the Cook Strait near the entrance to the Sound increases from October through to January every year, with a most likely increase ranging between +0.8 and +1.0˚C at its peak in January. But the aquaculture industry needs access to more localised forecasts.”
That is precisely why NIWA scientists are now comparing sea surface temperatures measured at many locations within regions that aren’t covered in the current models with those in wider regions. Long-range forecasts also become less certain further into the future, so keep an eye on the predictions as summer develops and will be producing a monthly NIWA forecast and posting updates on this page.
This work is funded through NIWA’s Strategic Science Investment Fund from the Ministry for Business, Innovation and Employment.
Forecast Cook Strait SST anomalies (˚C) over the next 6 months
| Month | 25th percentile | 50th percentile | 75th percentile |
| October 2021 | 0.34 | 0.45 | 0.48 |
| November 2021 | 0.43 | 0.54 | 0.60 |
| December 2021 | 0.70 | 0.89 | 0.90 |
| January 2022 | 0.82 | 0.97 | 0.98 |
| February 2022 | 0.70 | 0.86 | 0.95 |
| March 2022 | 0.61 | 0.83 | 0.87 |
Disclaimer: The forecasts offered in this page draw upon modified Copernicus Climate Change Service Information [2022](C3S, https://climate.Copernicus.eu). There is inherent uncertainty in forecasting sea surface temperature and neither NIWA nor the licensors of the C3S products (being the European Union represented by the European Centre for Medium-Range Weather Forecasts) make any representations or warranties as to the information and figures on this page. Neither NIWA nor the licensor of the Copernicus products accept any liability for any loss or damage incurred by anyone from use or reliance on the information or figures.
This work is funded through NIWA’s Strategic Science Investment Fund from the Ministry for Business, Innovation and Employment.