Rainfall outlook for November 2002 to January 2003
Enhanced convection and above average rainfall in Western and Eastern Kiribati
Rainfall trending towards below average in many countries from Papua New Guinea across to the Austral Islands, especially New Caledonia to Niue
The El Niño-related regions of enhanced convection should persist affecting Western and Eastern Kiribati during the November 2002 to January 2003 period, resulting in continued above average rainfall in that region, with above average or average rainfall likely in Wallis & Futuna, Tuvalu and Tokelau.
Below average or average rainfall is expected from Fiji to the Austral Islands, including Samoa and Southern Cook Islands. Below average rainfall is expected for Vanuatu, New Caledonia, Tonga and Niue. Near average rainfall is more likely elsewhere.
The forecast model skills are generally moderate. However skill levels are high in the central equatorial region.
Rainfall outlook map for November 2002 to January 2003
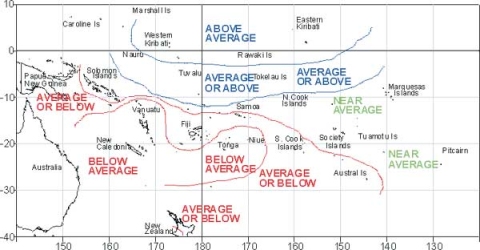
Probabilities of rainfall departures from average
Broad-scale rainfall patterns and anomalies in the southern tropical Pacific area are estimated from the state of large-scale regional climate factors, such as La Niña or El Niño, their effect on the South Pacific and Tropical Convergence Zones, surface and sub-surface sea temperatures, and computer models of the global climate.
Rainfall estimates for the next three months for Pacific Islands are given in the adjacent table. The tercile probabilities (e.g. 20:30:50) are derived from the interpretation of several global climate models. They correspond to the odds of the observed rainfall being in the lowest (driest) one third of the rainfall distribution, the middle one third, or the highest (wettest) one third of the distribution. On the long-term average, rainfall is equally likely (33% chance) in any tercile.
The probabilities shown express the expected shift in the distribution from the long-term average, based on predictions of oceanic and atmospheric conditions. The amount of inter-model forecast consistency is indicated by the levels of confidence expressed in the table.
| Island Group | Rainfall Outlook | Confidence in the Outlook | |
|---|---|---|---|
| Western Kiribati | 10:15:75 | (Above) | High |
| Eastern Kiribati | 10:15:75 | (Above) | High |
| Wallis & Futuna | 15:40:45 | (Average or above average) | Moderate |
| Tuvalu | 15:40:45 | (Average or above average) | Moderate |
| Tokelau | 20:35:45 | (Average or above average) | Moderate |
| Papua New Guinea | 40:45:15 | (Near average) | Moderate |
| Solomon Islands | 30:55:15 | (Near average) | Moderate |
| Northern Cook Islands | 30:50:20 | (Near average) | Moderate |
| Society Islands | 25:50:25 | (Near average) | Moderate |
| Pitcairn Island | 25:50:25 | (Near average) | Moderate |
| Marquesas Island | 30:50:20 | (Near average) | Low |
| Fiji | 40:45:15 | (Average or below average) | Moderate |
| Samoa | 40:40:20 | (Average or below average) | Moderate |
| Southern Cook Islands | 45:40:15 | (Average or below average) | Moderate |
| Austral Island | 45:40:15 | (Average or below average) | Moderate |
| Vanuatu | 50:25:25 | (Below average) | Moderate |
| New Caledonia | 55:30:15 | (Below averge) | High |
| Tonga | 50:35:15 | (Below average) | Moderate – High |
| Niue | 50:30:20 | (Below average) | Moderate – High |
Rainfall outcomes as estimated from models and historical records. The third column indicates the probability of bottom (below), middle (average) or top (above) tercile rainfall, where a percentage is given. The rainfall outlook (second column) is subjectively estimated from the probabilities of bottom, middle and top terciles.