Introduction
The development of updated national climate projections for Aotearoa New Zealand was completed in mid 2024.
The data is available from the Ministry for the Environment (MfE), along with a map-based geospatial tool to display the climate projections data and insights into the data.
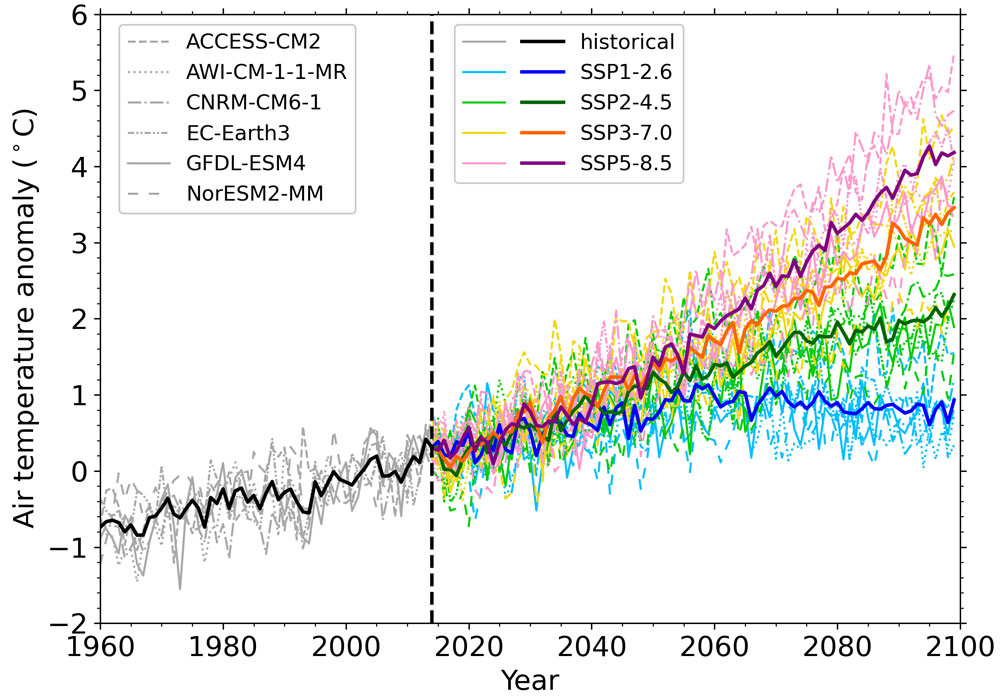
Data has been generated for the recent historic period plus four future Shared Socioeconomic Pathway (SSP)-Representative Concentration Pathway (RCP) scenarios out to the year 2100. The four SSPs are: SSP1-2.6, SSP2-4.5, SSP3-7.0 and SSP5-8.5.
Find out more about how NIWA can help you leverage the updated climate projections.
Background
The work is supporting Aotearoa’s transition to a low-emissions, climate-resilient economy. It helps New Zealanders better understand their climate-related risks by enabling access to the latest detailed climate projections for all New Zealanders. This will improve decision-making for climate adaptation and support resilience to extreme weather events.
The Working Group 1 contribution to the IPCC Sixth Assessment Report was published in August 2021 and was based on the latest suite of global climate model outputs – called the Coupled Model Intercomparison Project Phase 6, or CMIP6. CMIP6 includes around 100 models. See Aotearoa New Zealand climate change projections guidance (Ministry for the Environment) for more details.
NIWA has used six global models from this set and experimented with three regional climate models and sophisticated statistical/machine-learning approaches to develop this next of high resolution projections specific to New Zealand, via a process known as downscaling.
The six global models are: ACCESS-CM2, NorESM2-MM, EC-Earth3, GFDL-ESM4, AWI-CM-1-1MR and CNRM-CM6-1. We have selected these six global models based on their performance over our region (using model output for the period 1980-2015 compared to global observational reanalysis data and based on a large number of climate variables and indicators). We have also ensured that the models span a range of climate model sensitivities and are relatively independent from one another (i.e., they do not share major parts of the model code).
Published alongside this model suite will be downscaled projections from the New Zealand Earth System Model (NZESM), developed here in New Zealand through the Deep South Challenge to improve our understanding of the Southern Hemisphere processes that strongly influence our climate.
The work has been funded by the Ministry for Business, Innovation and Employment (with the contract managed by the Ministry for the Environment). This means the model outputs will be made available at no cost to all New Zealanders.
Project stages
Project stages include:
- Completed: Selection of climate models from the CMIP6 suite (this has been done, with six global models and three regional models selected), setup and testing.
- Completed: Regional climate model runs using NIWA’s High Performance Computing Facility.
- Completed: Further data downscaling using statistical and machine learning approaches.
- Completed: Bias correction.
- Completed: Data post-processing and developing an appropriate mechanism to make datasets accessible to end users.
- Completed: Downscaling, bias correction and processing of SSP5-8.5 projections.
The selection of the four SSPs for dynamical downscaling (three initially and one later) was heavily influenced by computing constraints, with the decision to not select SSP1-1.9 based on the recommendations of the international CORDEX downscaling community to prioritise the middle three SSPs. We also took into account the decision of the Deep South National Science Challenge to select the same three SSPs for the NZ Earth System Model runs and noted that this decision was based on a stakeholder survey.

The regional climate model runs for the first three SSPs took approximately 1 year to complete (June 2022 through June 2023). This aspect of the project (Project Stage 2) used approximately 70% capacity of one NIWA supercomputer (requiring over 12 million core hours in total). This computing power is equivalent to running more than 150 high end laptops non-stop for a year.
More detail can be found in reports on Methodology and Bias Correction (written by NIWA for the Ministry for the Environment).
Project outputs – core public dataset
For all the listed climate variables below, downscaled data (GIS-ready files at 5 km spatial resolution for all NZ) will be available for:
- the average of the six global models outlined above
- three SSPs (with SSP5-8.5 added in early 2025)
- three future periods (2021-2040, 2041-2060 and 2081-2100)
- four global warming levels (1.5°C, 2°C, 3°C and 4°C) (* see below for more details about warming levels)
- from two historical baselines (1986-2005 and 1995-2014).
These time slices, warming levels and baselines are consistent with the IPCC Working Group 1 Atlas (click on the Regional Information (Advanced) link).
In addition to the above datasets there is already public access to projected changes in extreme rainfall via HIRDS (which NIWA will be looking to update) and to the 100-year ARI storm tide coastal inundation layers for current day and 10 cm increments of sea-level rise up to 2 m.
| Climate variable | Annual | Seasonal |
| Average daily air temperature: Tmin, Tmax, Tmean, Trange | x | x |
| Number of hot days (>25°C) | x | x |
| Number of frost days (<0°C) | x | x |
| Number of very hot days (>30°C) | x | x |
| Temperature on hottest and coldest days of year | x | |
| Growing degree days (base 5°C & 10°C) | x | |
| Cooling degree days (base 18°C) | x | |
| Heating degree days (base 18°C) | x | |
| Total rainfall | x | x |
| Number of dry days | x | x |
| Number of rainy days (>1mm) | x | x |
| Number of very rainy days (>25mm) | x | x |
| Heavy rainfall (99th percentile) | x | x |
| Drought (PED) accumulation | x | |
| Average wind speed | x | x |
| Number of windy days (>10m/s) | x | x |
| Strong wind (99th percentile) | x | x |
| Average relative humidity | x | x |
| Average solar radiation | x | x |
Other frequently requested information includes projected changes to river flows and flooding. NIWA is actively working on assessing changes to flood risk in their MBIE-funded Endeavour research programme and has begun work to update river flow projections.
* Notes about warming levels: Since the downscaled (i.e. CCAM, or Conformal Cubic Atmospheric Model) simulations begin in 1960, it was not possible to compute warming level change maps relative to a pre-industrial base period from CCAM. As such, the warming level change maps instead display the climate change signal relative to a modern base period (i.e. optionally 1986-2005 or 1995-2014). However, the future period associated with these change maps is based on when a global warming level is reached utilising data from the host GCM, defined as the 20-year window when the rolling mean reaches the corresponding global warming level relative to the pre-industrial mean (1850-1900), following the IPCC Atlas. For certain scenarios, a particular warming level may not be reached in all models. The multi-model mean for the corresponding warming level is therefore only included if at least four of the six models reach the warming level.
Example output
Animation showing hourly precipitation (yellow > red shading shows heavy precipitation) and cloud cover (white shading):
NIWA's additional climate modelling
In addition to the dynamical downscaling, NIWA will once again be producing climate projections based on statistical downscaling (although for the CMIP6 update we will be using more sophisticated Machine Learning methods). Development of this procedure was recently outlined in a peer-reviewed journal article: High-resolution downscaling with interpretable deep learning: Rainfall extremes over New Zealand. Benchmark evaluations show that this new method vastly outperforms traditional statistical downscaling approaches for rainfall and extreme events over New Zealand.
This work will downscale many more CMIP6 global models (at least 20). This will complement the dynamically downscaled projections by providing information based on a wider range of models and scenarios. This two-pronged approach is consistent with NIWA’s previous downscaling work.
Frequently asked questions about the CMIP6 downscaled data produced by NIWA:
What is downscaling and why is it needed?
Downscaling involves taking relatively coarse resolution global climate model output (typically 100-150km resolution) and enhancing the resolution over New Zealand. ‘Dynamical downscaling’, as performed here, uses a physics-based atmospheric computer model to perform the downscaling. Downscaling is especially needed over New Zealand since coarse resolution global models have several limitations for representing our unique regional climate. Statistical downscaling approaches, that often simply perform grid cell-based corrections, have important limitations. Although much cheaper to run, these simple statistical approaches generally cannot capture important smaller scale feedbacks in the climate system, such as how long-term changes in soil moisture or snow cover impact temperature trends.
How has the historical baseline data been evaluated?
After the dynamical downscaling was run at 12km resolution over New Zealand, several key variables were bias corrected to NIWA’s Virtual Climate Station Network (VCSN) gridded observational data at 5km resolution (Campbell et al., 2024a). As such, these bias corrected fields will have similar observational accuracy to VCSN, when assessed in a climatological sense (i.e. long-term averages). The largest uncertainty in VCSN is in locations where the underlying station density is relatively low (i.e. in high elevation regions, away from main population centres). Prior to bias correction, the 12km dynamical downscaled runs were also comprehensively evaluated in terms of mean fields and extremes (Gibson et al., 2024a; Campbell et al., 2024b).
It is important to note that model errors in the historical period do not necessarily translate to expected errors in the future projections. Instead, a better way to assess future projection uncertainty is to look at the range of model outcomes (i.e. across the six downscaled models) for a given variable or season. For example, Figure 1 below shows the spread of projected changes in precipitation for Auckland – note that some models predict increasing precipitation (i.e. change greater than 0) and some models predicting decreasing precipitation (i.e. change less than 0). These changes and associated uncertainty can also vary across seasons.

Where are the largest uncertainties and limitations in the climate projections?
For a given scenario (i.e. SSP) the largest uncertainty stems from the differences across the global climate models. While we targeted the top performing global climate models for the region, certain models can warm much faster or slower in response to the same amount of external forcing (i.e. ‘greenhouse’ gas emissions), and this is carried forward into the regional model projections. To account for this, we selected a range of different warming rates from the global models, aligned with the ‘likely range’ of warming from the latest IPCC sixth assessment report. The range across the downscaled projections (i.e. range from the six models) is therefore a practical and useful way to assess uncertainty in the projections, where each can be considered a plausible future outcome. Uncertainties also stem from the regional climate model uncertainty. For example, the assumptions that go into how rainfall is represented.
What is the downscaled model resolution? Why is it not higher?
The downscaled model resolution (i.e. from CCAM) is approximately 12km over New Zealand, this is then bias corrected and produced on a final 5km national for key variables. The main limit to going to higher resolution (i.e. beyond 12km) in dynamical downscaling is computational resources. It costs roughly 8-10 times the computational resources for a doubling of model resolution. The downscaled model resolution is considerably improved compared to the earlier CMIP5 downscaling (approximately 35km resolution) produced by NIWA.
What is a base period, and which should I use?
Base periods are used so that future changes can be assessed relative to a standard historical period that aligns with the current climatology or recent past. A commonly used historical baseline for CMIP6 is 1995–2014 (2014 being the last year of CMIP6 historical simulations). An additional baseline of 1986-2005 is provided for consistency with the pervious historical base period in CMIP5.
Why does the downscaled data on a particular date in the historical period (e.g. 7 December 2003) not look like observations on that same date?
Climate models are initialised from the distant past and so are not designed to provide relevant information on any individual day, just as we would not expect a weather forecast to be reliable several months or years out. Instead, the appropriate way to evaluate climate models is to look at long-term statistics from the output of the models and compare this to observations. For example, comparing 30-year averaged temperatures from the model, or annual trends across a 30-year (and longer) time-period.
If you require climate data to represent a different period and location (i.e., a time series) please reach out the NIWA for assistance with this. Additionally, NIWA can help develop bespoke climate indicators for a particular application.
What are some of the benefits in the updated CMIP6 downscaled data compared to the previous CMIP5 downscaled data?
The CMIP6 downscaling has various general improvements and advantages over the previous CMIP5 downscaling. The primary regional climate model is run at substantially higher resolution both over New Zealand (12km) and the wider South Pacific domain, enabled by the stretched grid configuration of the model. The stretched grid configuration may additionally help to more seamlessly resolve certain types of storms including ex-Tropical Cyclones, as they approach New Zealand. The biases from the updated CMIP6 downscaling were comprehensively evaluated and benchmarked against other candidate regional climate models, with these results published in the peer-reviewed literature (Gibson et al., 2024a; Campbell et al., 2024b). The global climate models from CMIP6 also have generally higher resolution relative to CMIP5, with some improvements in large-scale circulation features that are highly relevant to New Zealand (Simpson et al., 2020; Curtis et al., 2020). The CMIP6 downscaling is also driven by more up to date forcings, as included in the SSPs that replaced the RCPs from CMIP5. Lastly, through collaboration between NIWA and the Ministry for the Environment (MfE), the updated downscaled data has an improved pathway for data access and visualisation, available here.
How similar are these new projections to CMIP5 downscaled data?
This highly depends on the region, variable and season being considered. A comprehensive comparison is provided in Broadbent et al. (2025). While the main spatial patterns of change are similar (e.g. wetter in the west, and drier in the east and north of the country), regional differences can be important. The updated projections show slightly more warming by mid-century and end-of-century, and the drying signal over the North Island is more pronounced.
Why does the data end in 2100 and not go further out?
The limiting factor is from the global climate models in CMIP6 used for downscaling, where most end in year 2100 (with a final date of 31 December 2099). Care is required when extrapolating trends beyond this through statistical approaches, since projected changes can be non-linear.
Why have only these six GCMs been downscaled?
We have chosen six of the top performing GCMs to downscale. Further details of the GCM selection criteria are provided in Gibson et al. (2024). The main limiting factor is computational resources that go into performing the downscaling. Complementary research is underway at NIWA to use artificial intelligence (AI) and machine learning (ML) to downscale a larger ensemble to complement this effort (Rampal et al., 2024, 2025). While still under development, these more modern empirical approaches can have a number of benefits over traditional statistical downscaling (Rampal et al., 2022).
A particular variable/index that I am interested in is not provided, can it be made available?
NIWA can help with additional interpretation and analysis of the data, including translating this climate information to respond to adaptation, planning and reporting needs. You can find additional information on NIWA’s services related to this data here.
What downscaled GCM should I use?
There is generally no single best performing GCM. It is best practice to consider the spread across all downscaled GCMs.
What SSP should I use/is most likely to happen?
NIWA has prioritised downscaling SSP126, SSP245, and SSP370 scenarios. This is consistent with regional climate downscaling efforts in other regions and recommended by CORDEX. Broadly speaking, the SSP245 scenario can be interpreted as a ‘middle-of-the-road scenario’, while SSP370 can be interpreted as a relatively high emissions scenario.
Additionally, NIWA has conducted additional downscaling for MfE using SSP585. We suggest that the main value in using SSP585 lies in sampling very low probability and high impact future weather/climate events. However, this scenario should not be treated as ‘business-as-usual’ or the most likely scenario (Hausfather and Peters, 2020).
How should I interpret “low model agreement” in the projections?
Where models disagree on the sign of changes (e.g. whether rainfall in summer is projected to increase or decrease for a given region) this generally means that we have less confidence in the particular projection. This stems from differences in the projections from the global climate models, such as how dominant weather patterns are projected to change.
Do the projections include information about sea-level rise or coastal hazards?
These climate projections focus on changes over land. Sea-level rise and costal hazards projections for New Zealand have been recently produced under the NZ SeaRise Endeavour Research Programme funded by MBIE.
Do the projections include information about changes to river flows?
These climate projections focus on changes over land. River flow and flood risk changes are being investigated under a NIWA-led Endeavour Research Programme funded by MBIE.
How do these projections relate to the NIWA HIRDS tool?
The climate change component of HIRDS focuses on very extreme rainfall events based on return periods. The climate projections here are much broader than this (e.g. spanning different meteorological variables, regions, seasons, and indices). In the future, it is anticipated that these updated CMIP6 projections will be used as inputs into future releases of HIRDS.
How should I cite the downscaled data in my report or other publication?
Please cite the following:
Gibson, P. B., Stuart, S., Sood, A., Stone, D., Rampal, N., Lewis, H., Broadbent, A., Thatcher, M., & Morgenstern, O. (2024). Dynamical downscaling CMIP6 models over New Zealand: added value of climatology and extremes. Climate Dynamics, 27p.
Gibson, P. B., Campbell, I., Lewis, H., Rampal, N., Fedaeff, N., Woolley, J-M. (2024). User Guidance of CMIP6 Downscaled Data for Aotearoa New Zealand. NIWA Report prepared for MfE, 20p.
References
Gibson, P. B., Campbell, I., Lewis, H., Rampal, N., Fedaeff, N., Woolley, J-M. (2024b). User Guidance of CMIP6 Downscaled Data for Aotearoa New Zealand. NIWA Report prepared for MfE, 20p.
Campbell, I., Gibson, P.B., Rampal, N., (2024a). Bias Correction of Downscaled CMIP6 Output. NIWA Report prepared for MfE, 40p.
Gibson, P. B., Stuart, S., Sood, A., Stone, D., Rampal, N., Lewis, H., Broadbent, A., Thatcher, M., & Morgenstern, O. (2024a). Dynamical downscaling CMIP6 models over New Zealand: added value of climatology and extremes. Climate Dynamics, 27p.
Campbell, I., Gibson, P. B., Stuart, S., Broadbent, A. M., Sood, A., Pirooz, A. A., & Rampal, N. (2024b). Comparison of three reanalysis‐driven regional climate models over New Zealand: Climatology and extreme events. International Journal of Climatology, 44(12), 4219-4244.
Gibson, P.B., Rampal, N., Dean, S.M., & Morgenstern, O. (2024) Storylines for Future Projections of Precipitation Over New Zealand in CMIP6 Models. JGR Atmospheres, 129(5), e2023JD039664
Rampal, N. et al. (2024). Enhancing Regional Climate Downscaling through Advances in Machine Learning. Artificial Intelligence for the Earth Systems 3(2)
Gibson, P.B. et al. (2023) High-Resolution CCAM Simulations Over New Zealand and the South Pacific for the Detection and Attribution of Weather Extremes. JGR Atmospheres 128(14) e2023JD038530
Simpson, I. R., Bacmeister, J., Neale, R. B., Hannay, C., Gettelman, A., Garcia, R. R., ... & Richter, J. H. (2020). An evaluation of the large‐scale atmospheric circulation and its variability in CESM2 and other CMIP models. Journal of Geophysical Research: Atmospheres, 125(13), e2020JD032835.
Curtis, P. E., Ceppi, P., & Zappa, G. (2020). Role of the mean state for the Southern Hemispheric jet stream response to CO2 forcing in CMIP6 models. Environmental Research Letters, 15(6), 064011.
Rampal, N., Gibson, P. B., Sood, A., Stuart, S., Fauchereau, N. C., Brandolino, C., ... & Meyers, T. (2022). High-resolution downscaling with interpretable deep learning: Rainfall extremes over New Zealand. Weather and Climate Extremes, 38, 100525.
Rampal, N., Gibson, P. B., Sherwood, S., & Abramowitz, G. (2024). On the extrapolation of generative adversarial networks for downscaling precipitation extremes in warmer climates. Geophysical Research Letters, 51(23), e2024GL112492.
Rampal, N., Gibson, P. B., Sherwood, S., Abramowitz, G., & Hobeichi, S. (2025). A reliable generative adversarial network approach for climate downscaling and weather generation. Journal of Advances in Modeling Earth Systems, 17(1), e2024MS004668.
Hausfather, Z., & Peters, G. P. (2020). RCP8. 5 is a problematic scenario for near-term emissions. Proceedings of the National Academy of Sciences, 117(45), 27791-27792.
Broadbent et al. (2025). How do New Zealand’s downscaled CMIP6 climate projections compare with CMIP5? Weather and Climate (accepted for publication)