In the commentary for Christchurch next to the official rainfall records for March are the words “well above normal”.
In fact, a rain gauge in Riccarton, Christchurch, endured its wettest March since records began in 1863. And, of the 200mm that fell during the month, 123mm came down on just one day. That made 4 March the greatest one day March rainfall on record for that location.
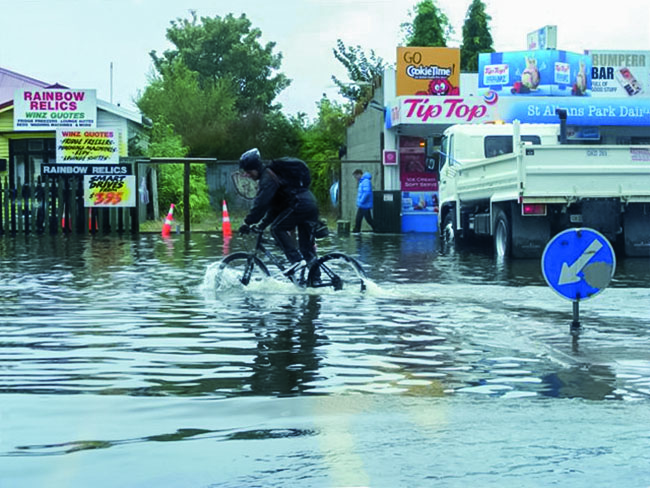
So much rain inevitably caused considerable flooding throughout Christchurch and much of the surrounding area. Schools were closed, slips blocked roads and homes were inundated, including at least 100 houses in the surburbs of Woolston, Richmond, St Albans and Mairehau.
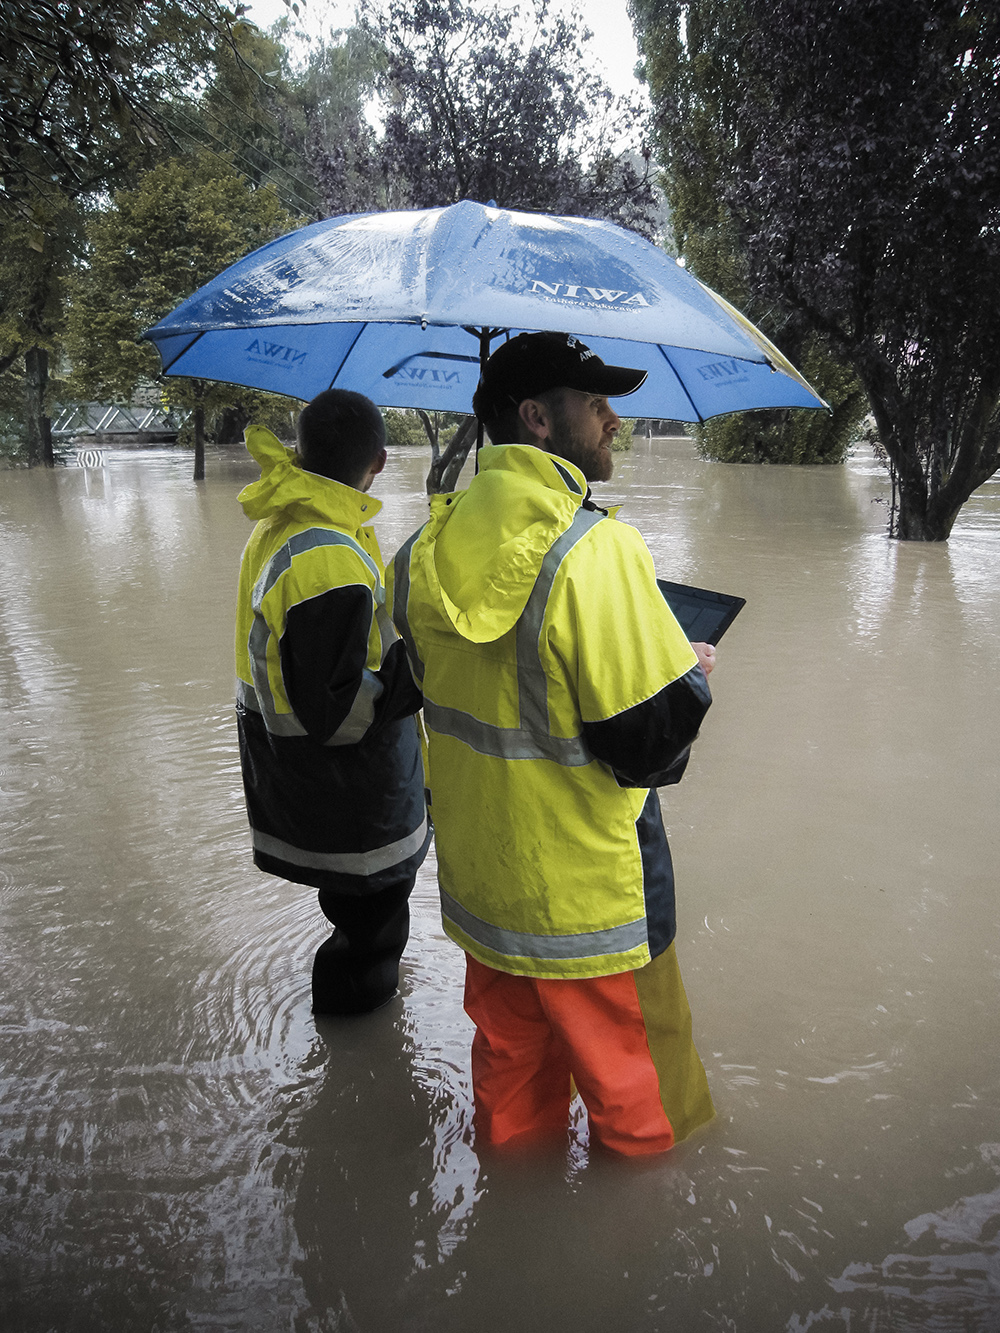
As the water came down, NIWA scientists got to work. They were out in the elements analysing floodwater levels and mapping the worst-affected suburbs.
But in the days that followed, they realised the scale of the floods was so great they could do with the public’s help. So they sent out an appeal via local and social media, for photographs. Residents were asked to email any photos they had of the flooding, especially the peak water levels.
Coordinating the project was Dr Graeme Smart, NIWA’s principal scientist of natural hazards and hydrodynamics.
“We had an incredibly quick and extensive response. We were very grateful that so many people were so willing to help,” he said.
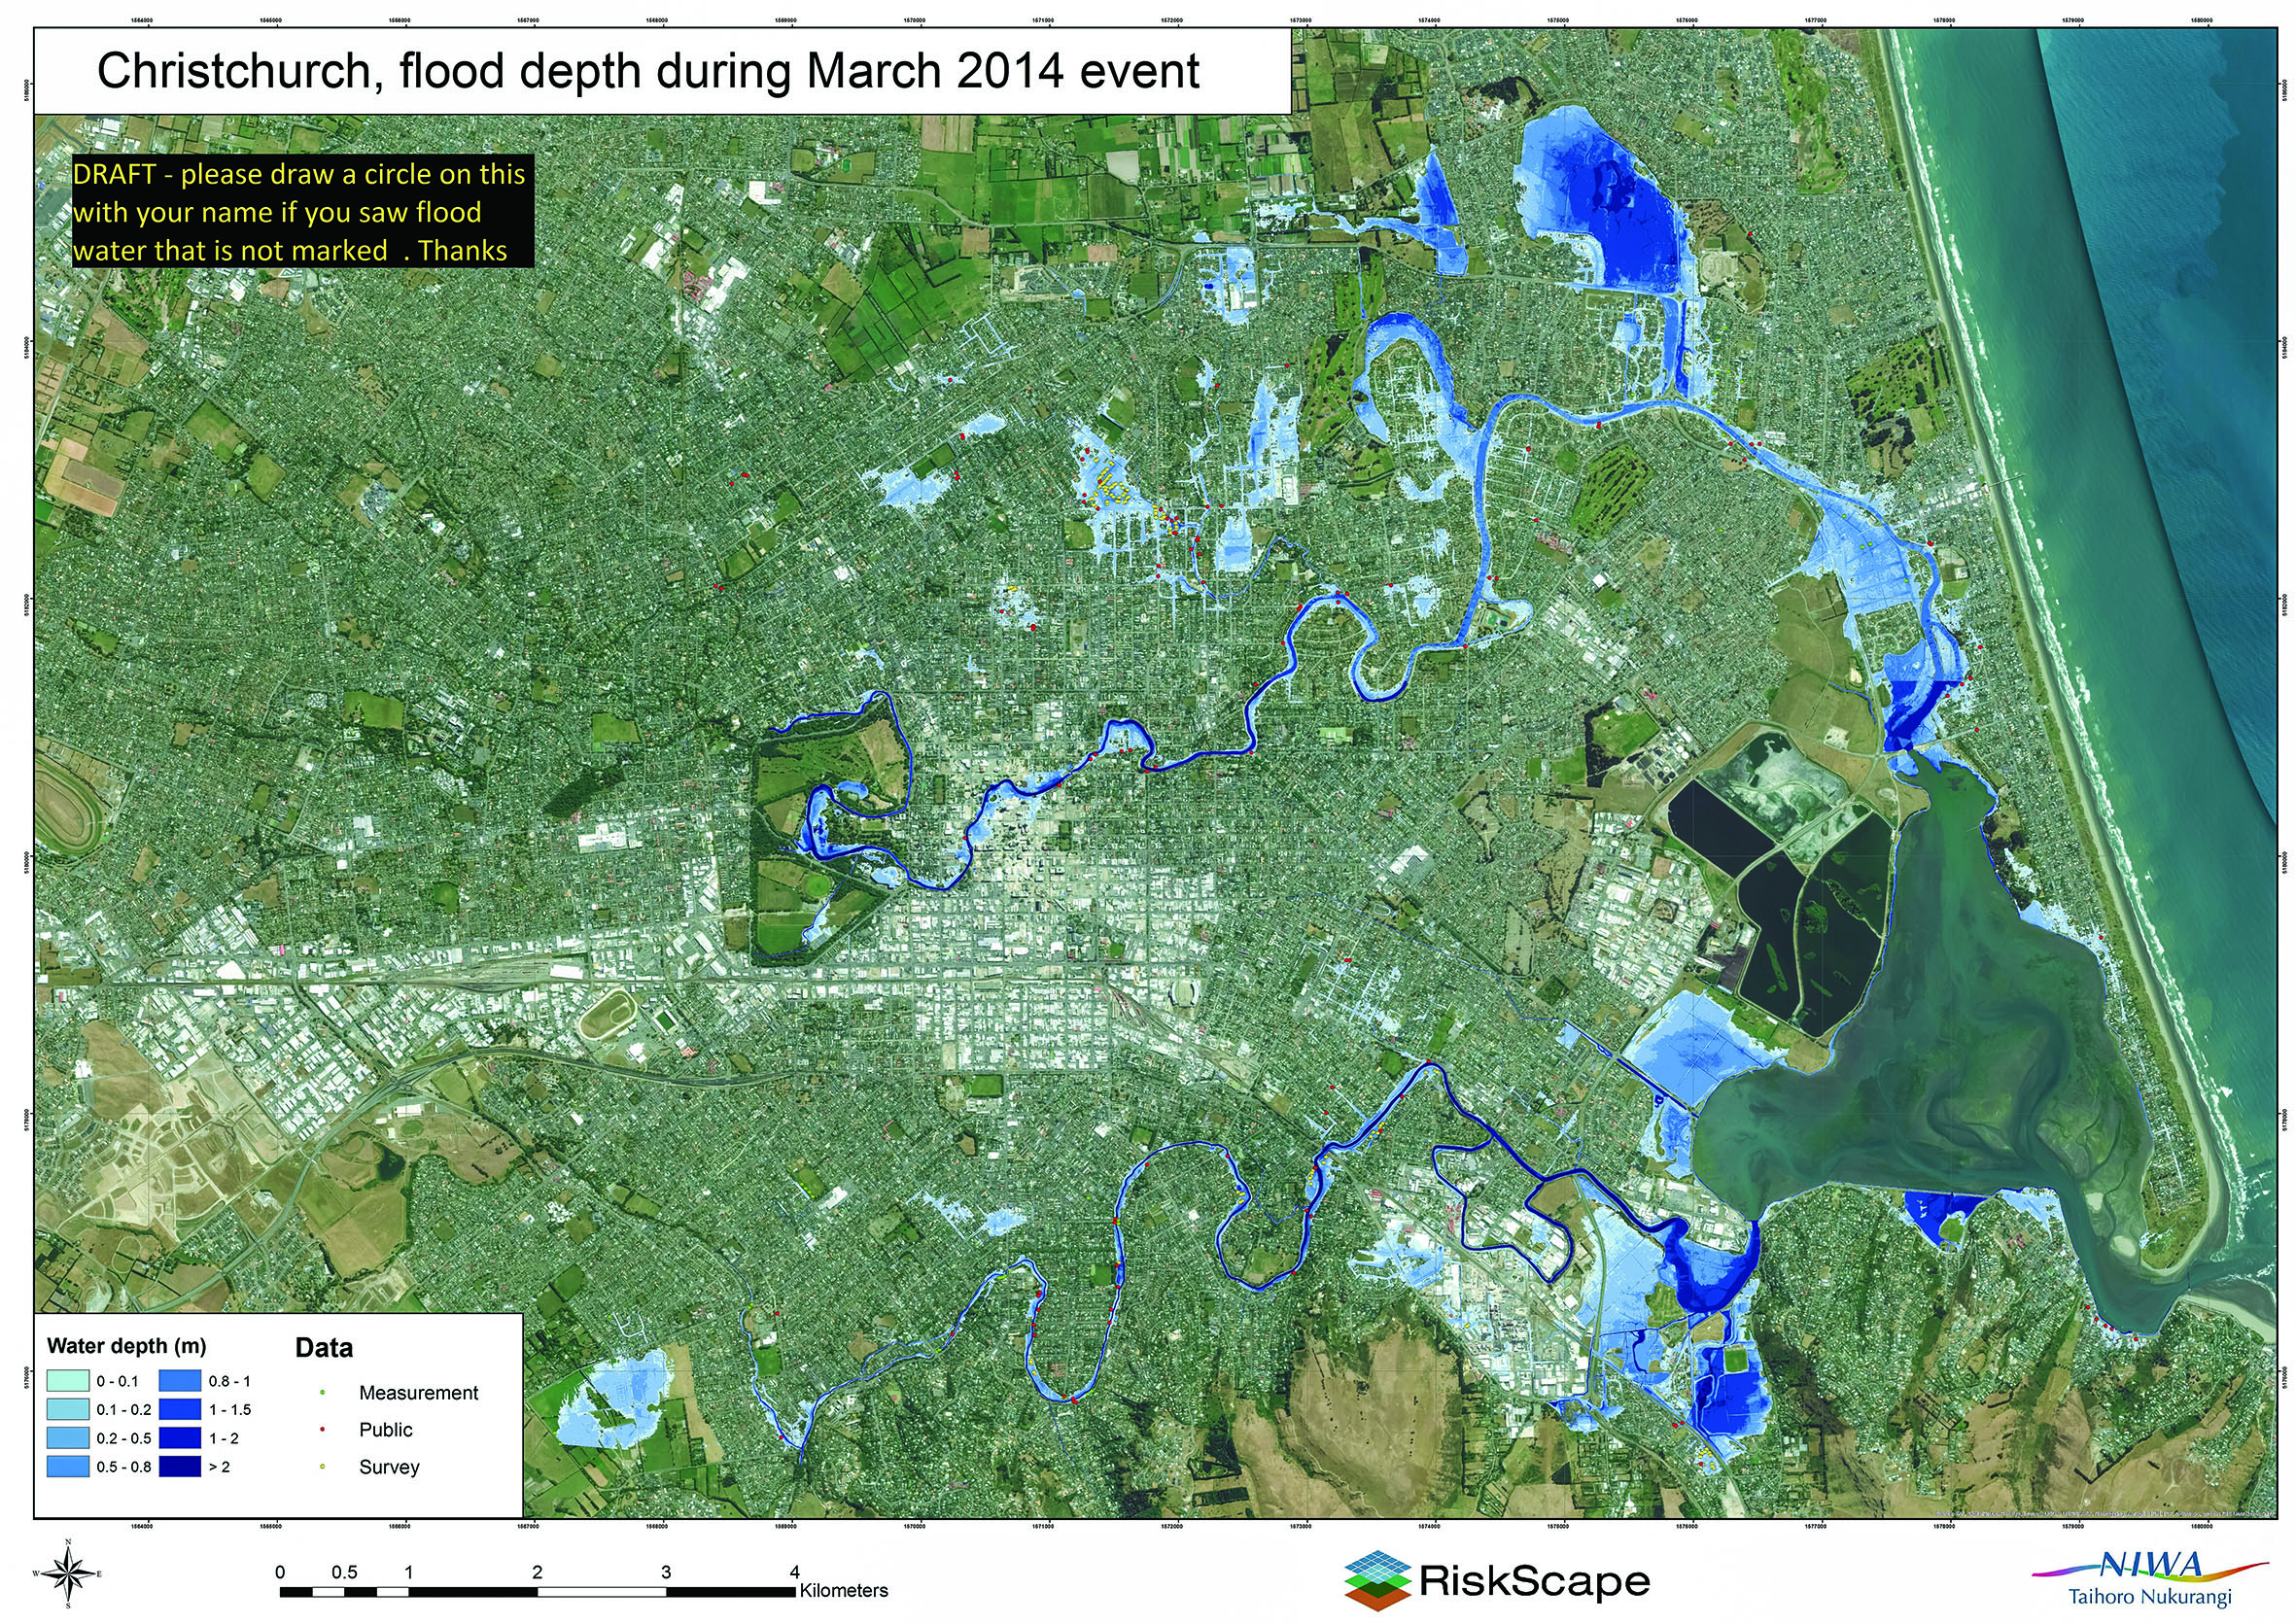
In the space of a few days, more than 500 photos were received and work began on refining a flood map of the event using some of the evidence provided by residents.
The first step in the project has been to establish the exact location of each photograph. Then the water level in each photograph has to be calculated. Where the water can be seen against a recognisable landmark such as a doorstep or fence paling, a survey team will be sent to determine the precise level.
If the edge of the water is shown on a field, road or footpath, the information needed is determined from existing ground level information gathered by post-earthquake, airborne laser surveys. Other information is also being collated from a record of emergency callout locations and from technicians who were sent out during the flood itself.
Once all the information has been added to the map, the floodwater depths are then used in conjunction with a scientific model known as RiskScape, to calculate the human and economic costs of the flooding. For instance, in the suburb of Mairehau, the calculations predict an estimated 47 houses were affected by the March flood. Using the provisional data, Riskscape calculates they will cost $1.28 million to repair with $900,000 lost in content damage. When the cost of the cleaning up is added in, the cost of house flooding in Mairehau totals about $2.2 million.
RiskScape also indicates that if floor levels of the vulnerable buildings had been raised by 10cm, the cost of the house flooding in Mairehau would have been halved. And if floor levels had been raised by up to 45cm there would have been no house-related flood damage.
Dr Smart said using the modelling programme, scientists could artificially raise floor levels to see how much the damage is reduced. “This is particularly useful for deciding on priorities for building flood protection works,” he said.
Rainfall in March:
March 4:
- 123mm at Riccarton
- 153mm at Lyttelton
All of March:
- 200mm at Riccarton