12 January 2023
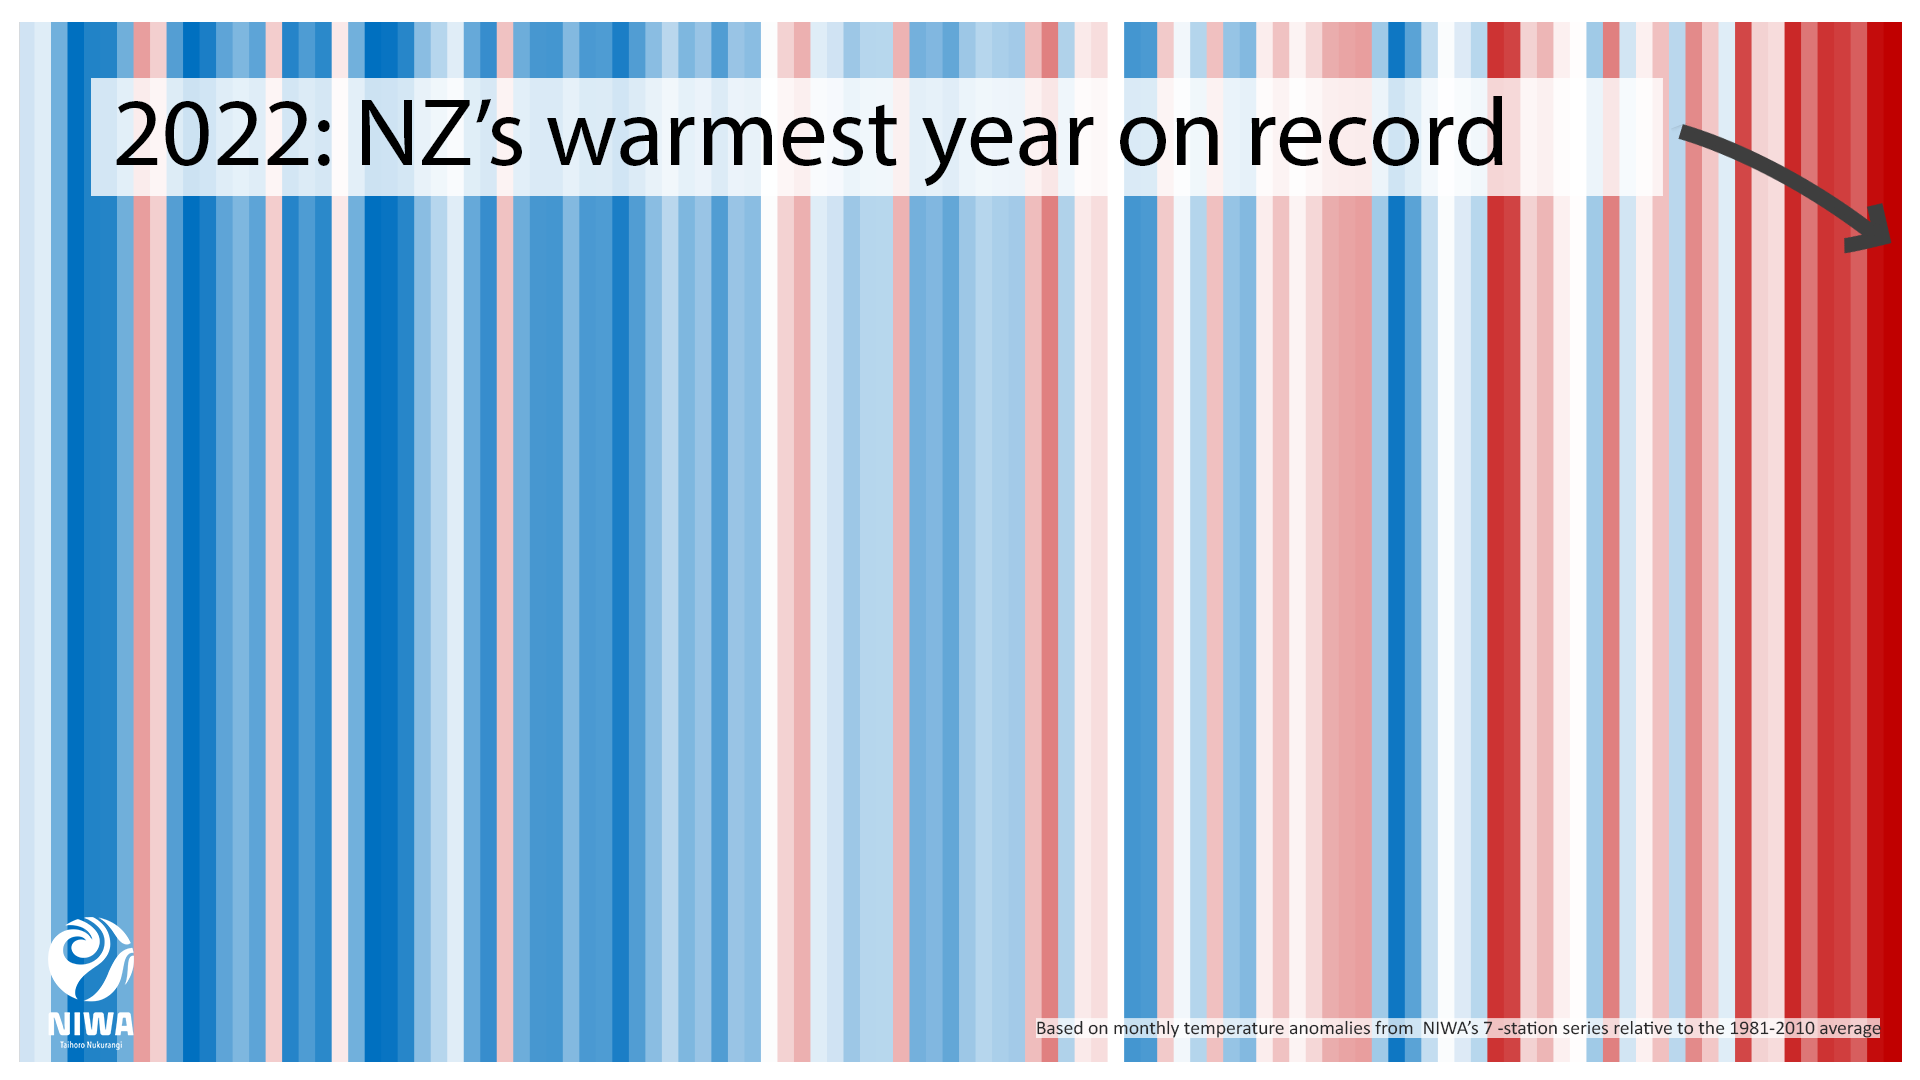
It's official - last year was once again Aotearoa's warmest on record, knocking 2021 off the top spot. It was also the 8th most unusually wet year on record – meaning lots of rain fell in unusual places.
Highlights:
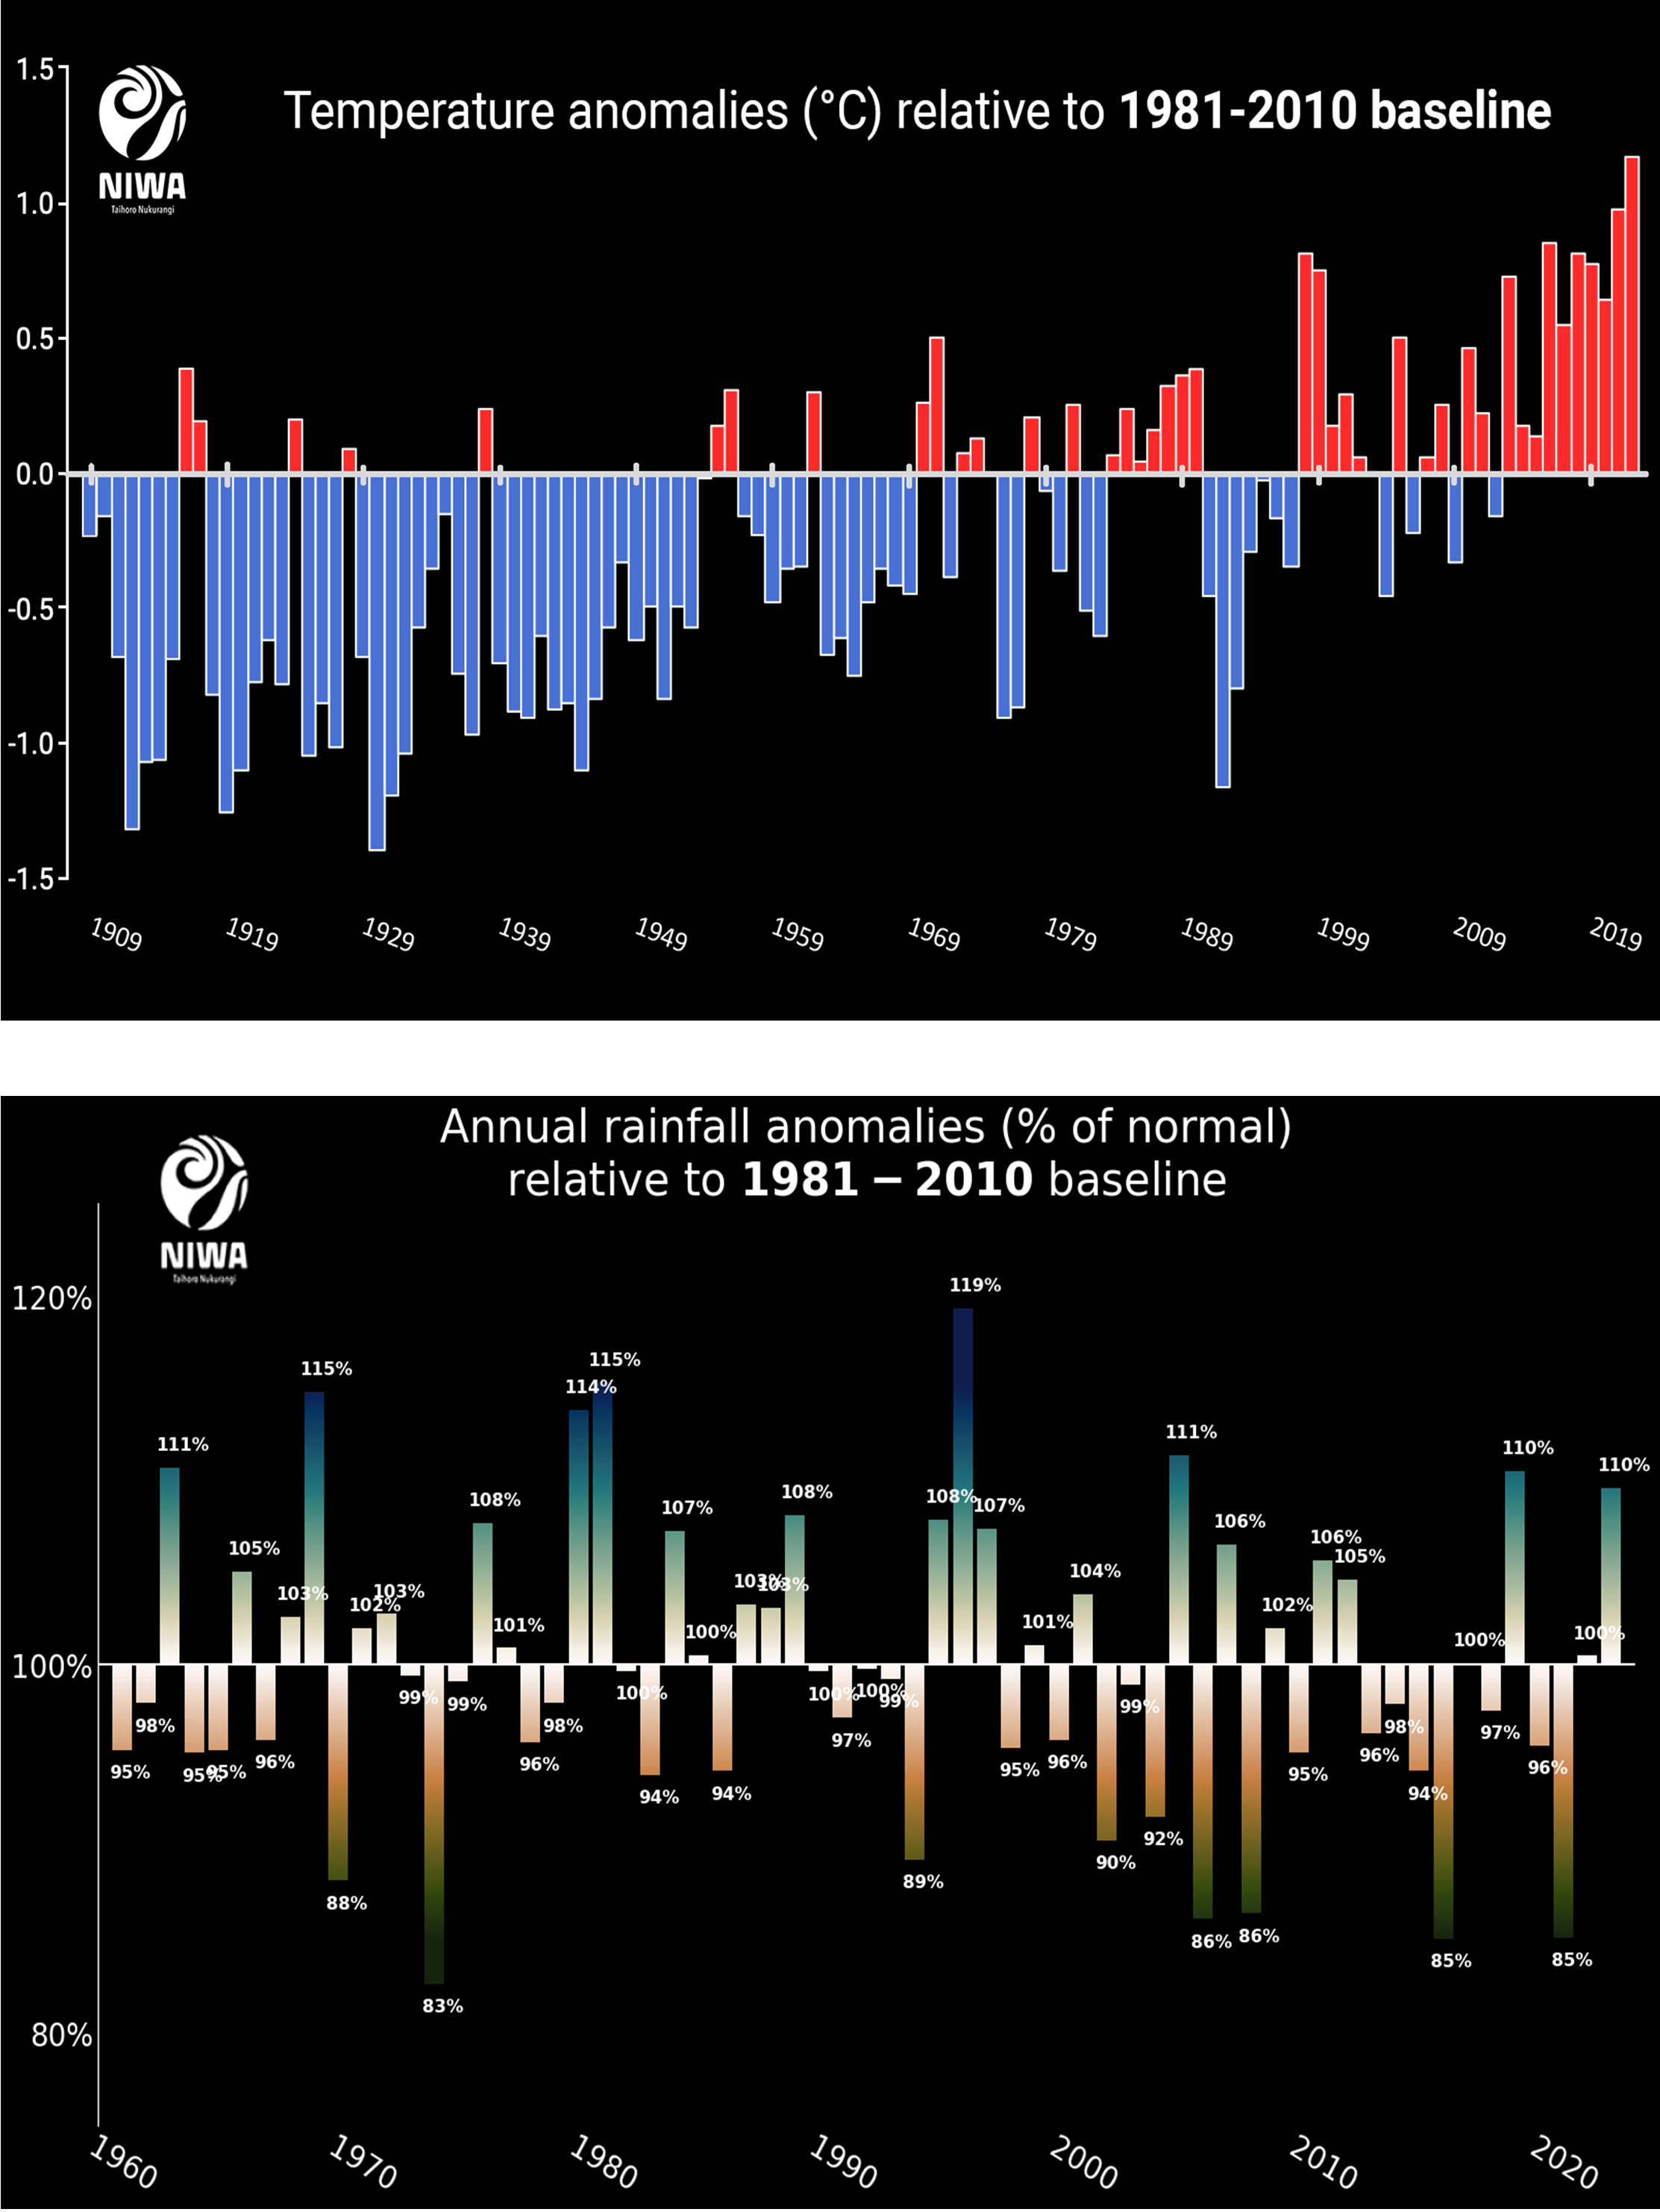
- The nationwide average temperature was 13.76°C, +1.15°C above the 1981-2010 annual average and surpassing 2021 by +0.20°C.
- The top 4 warmest years on record have all occurred since 2016.
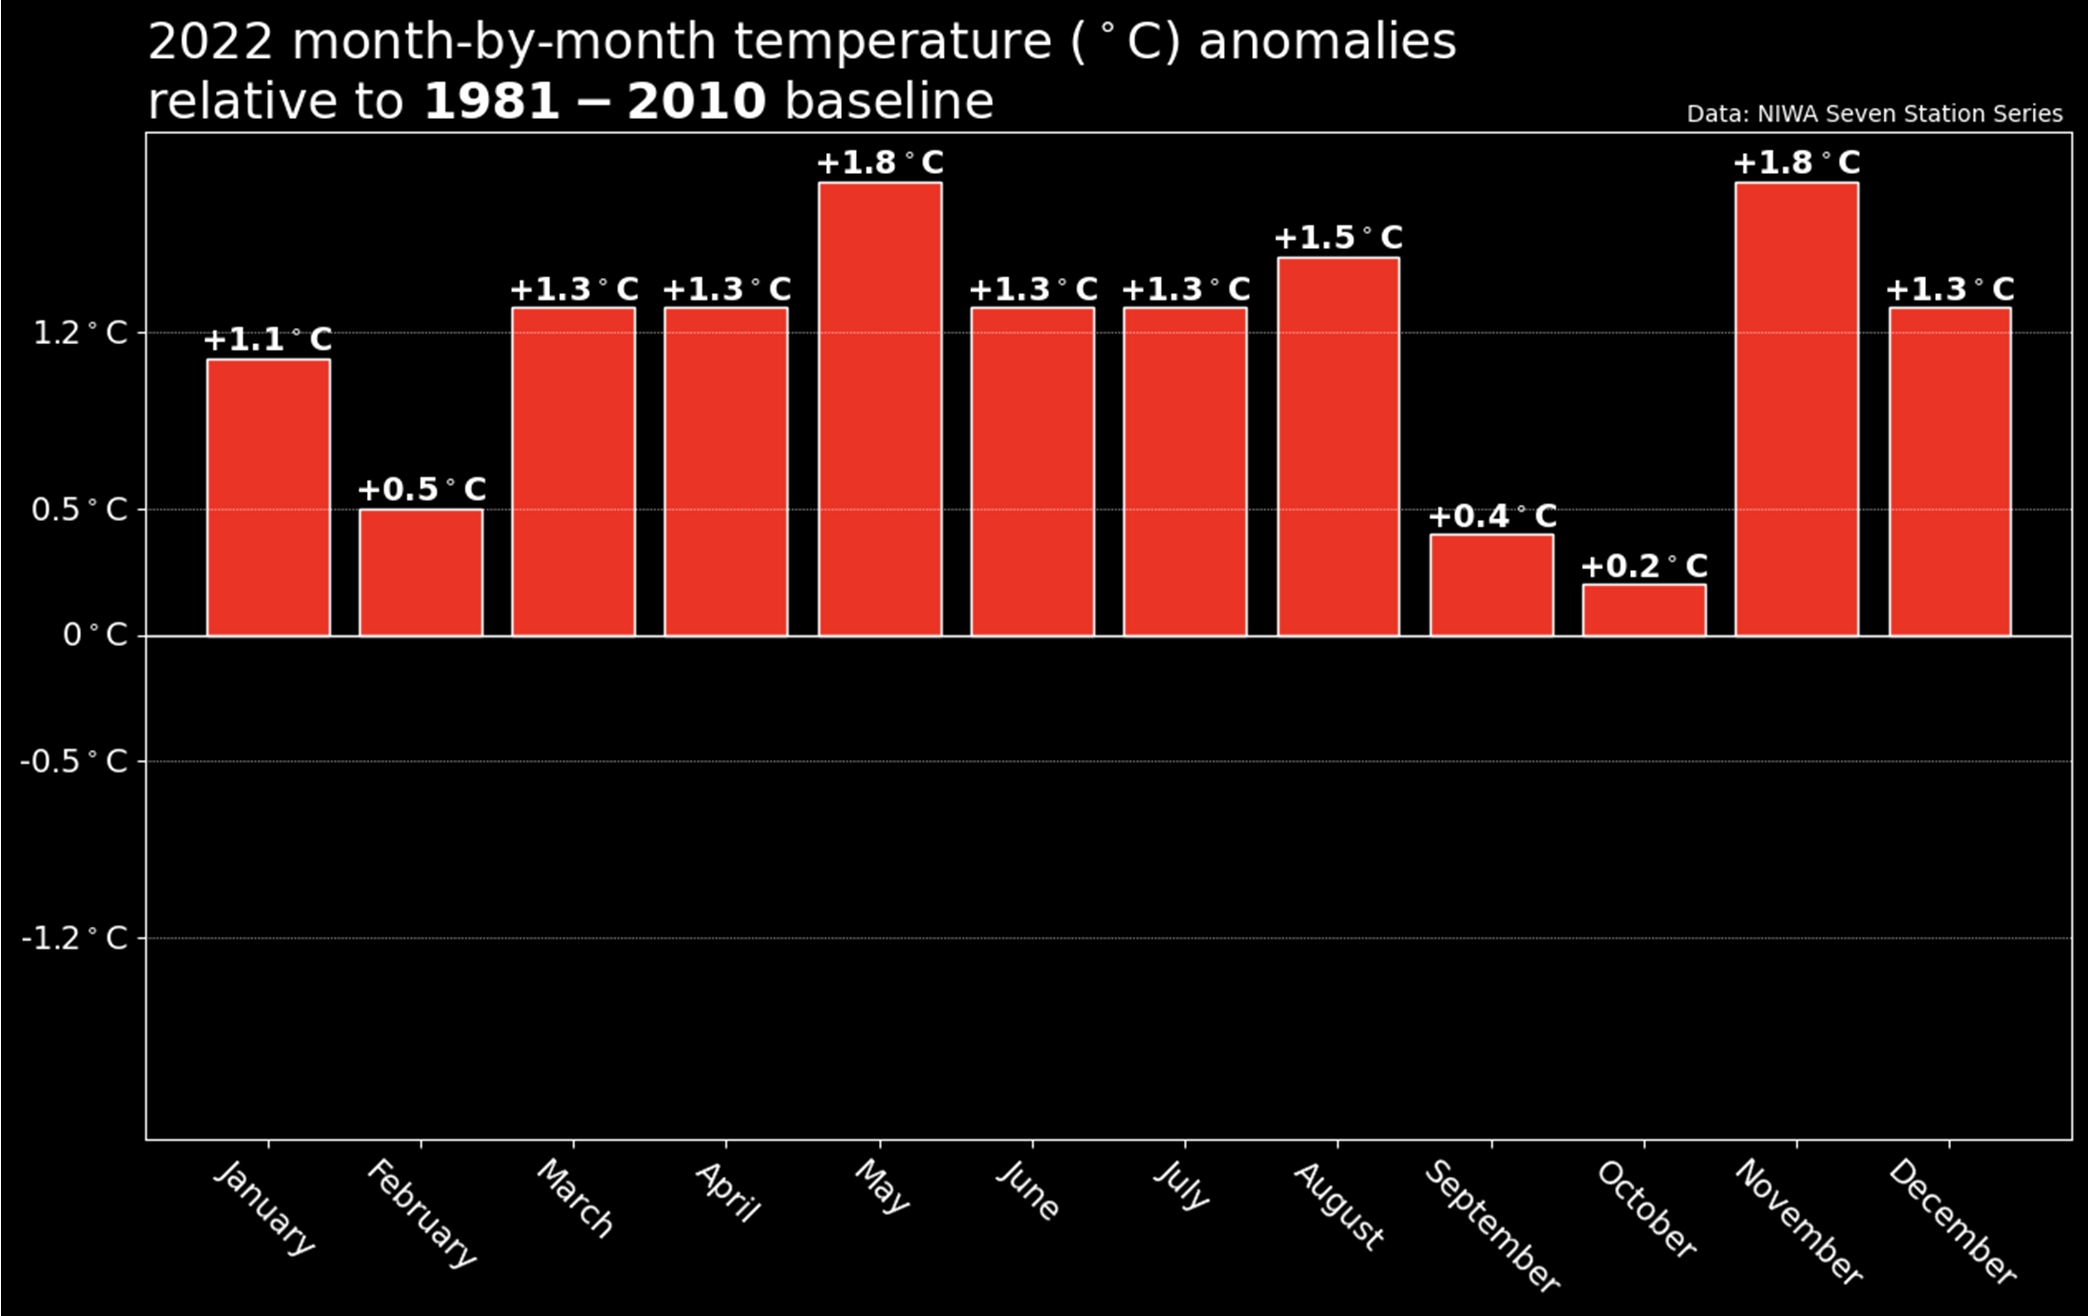
- No months were below average in temperature, with November being the most unusually warm.
- The nationwide rainfall anomaly was 110%.
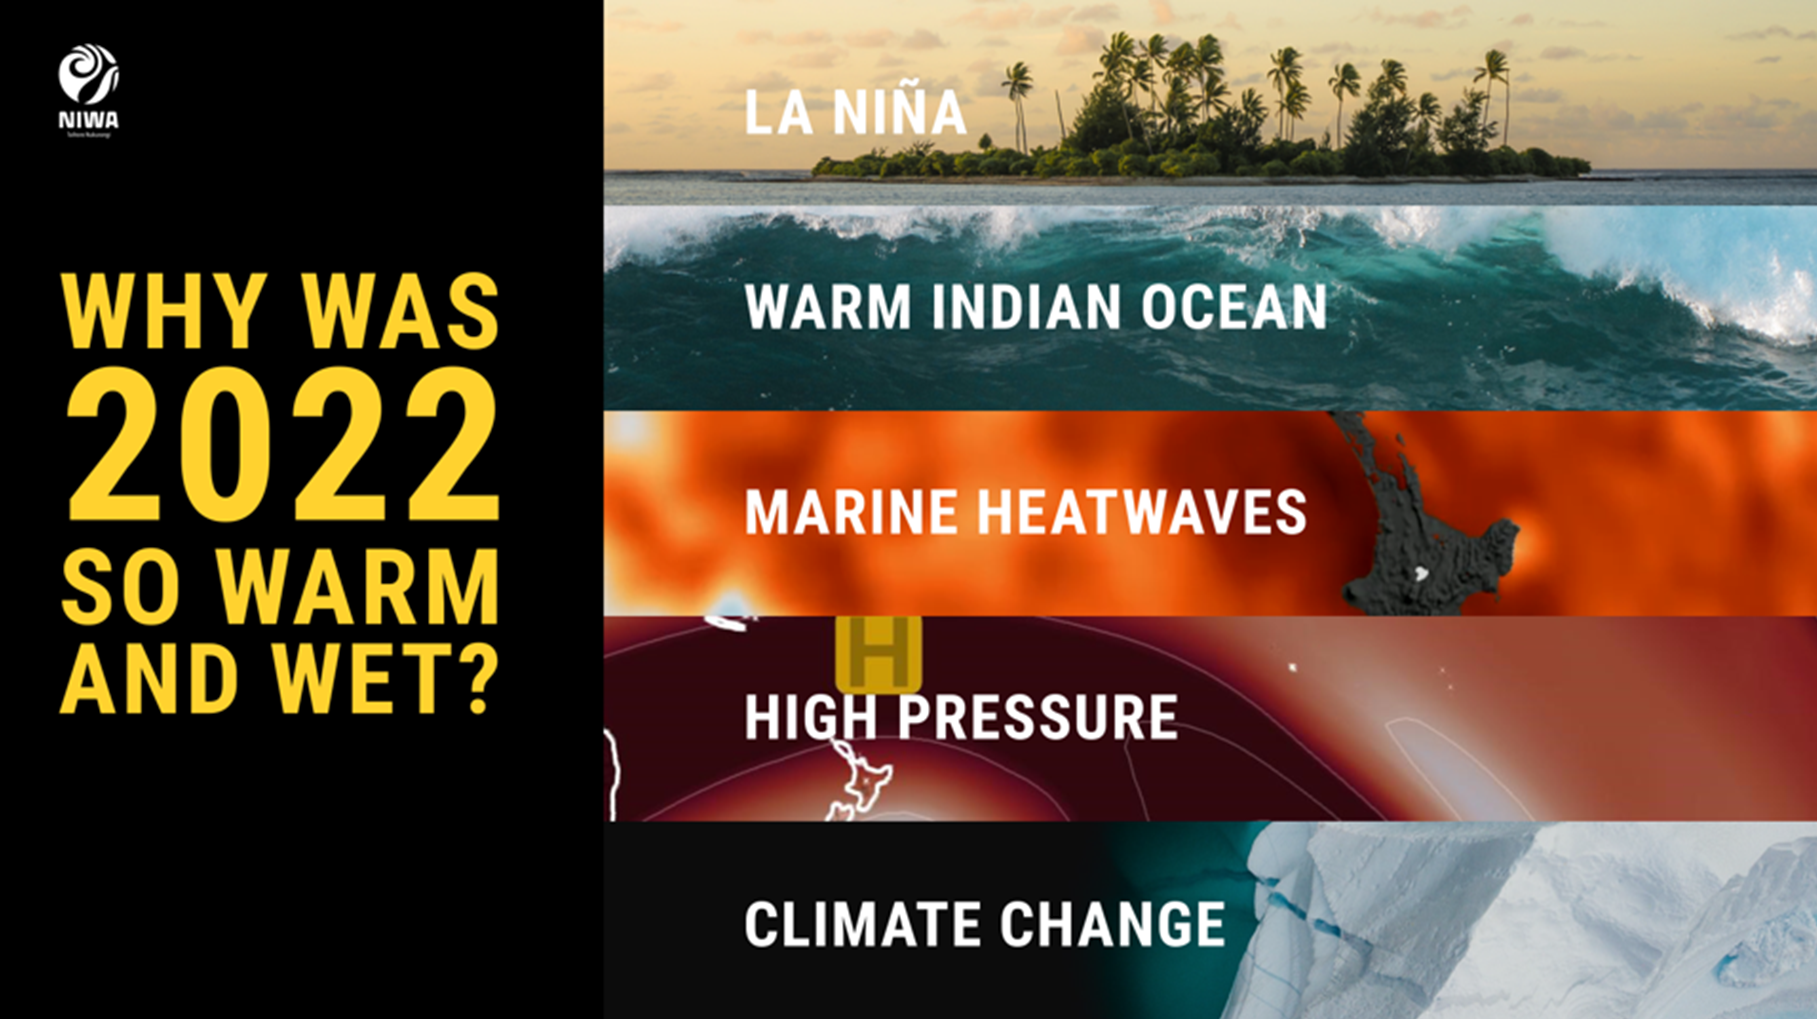
- La Niña was one of the primary drivers of last year's weather patterns.
- Sea surface temperatures near New Zealand also had a big impact, being above or well above average every month and resulting in a marine heatwave for most of the year
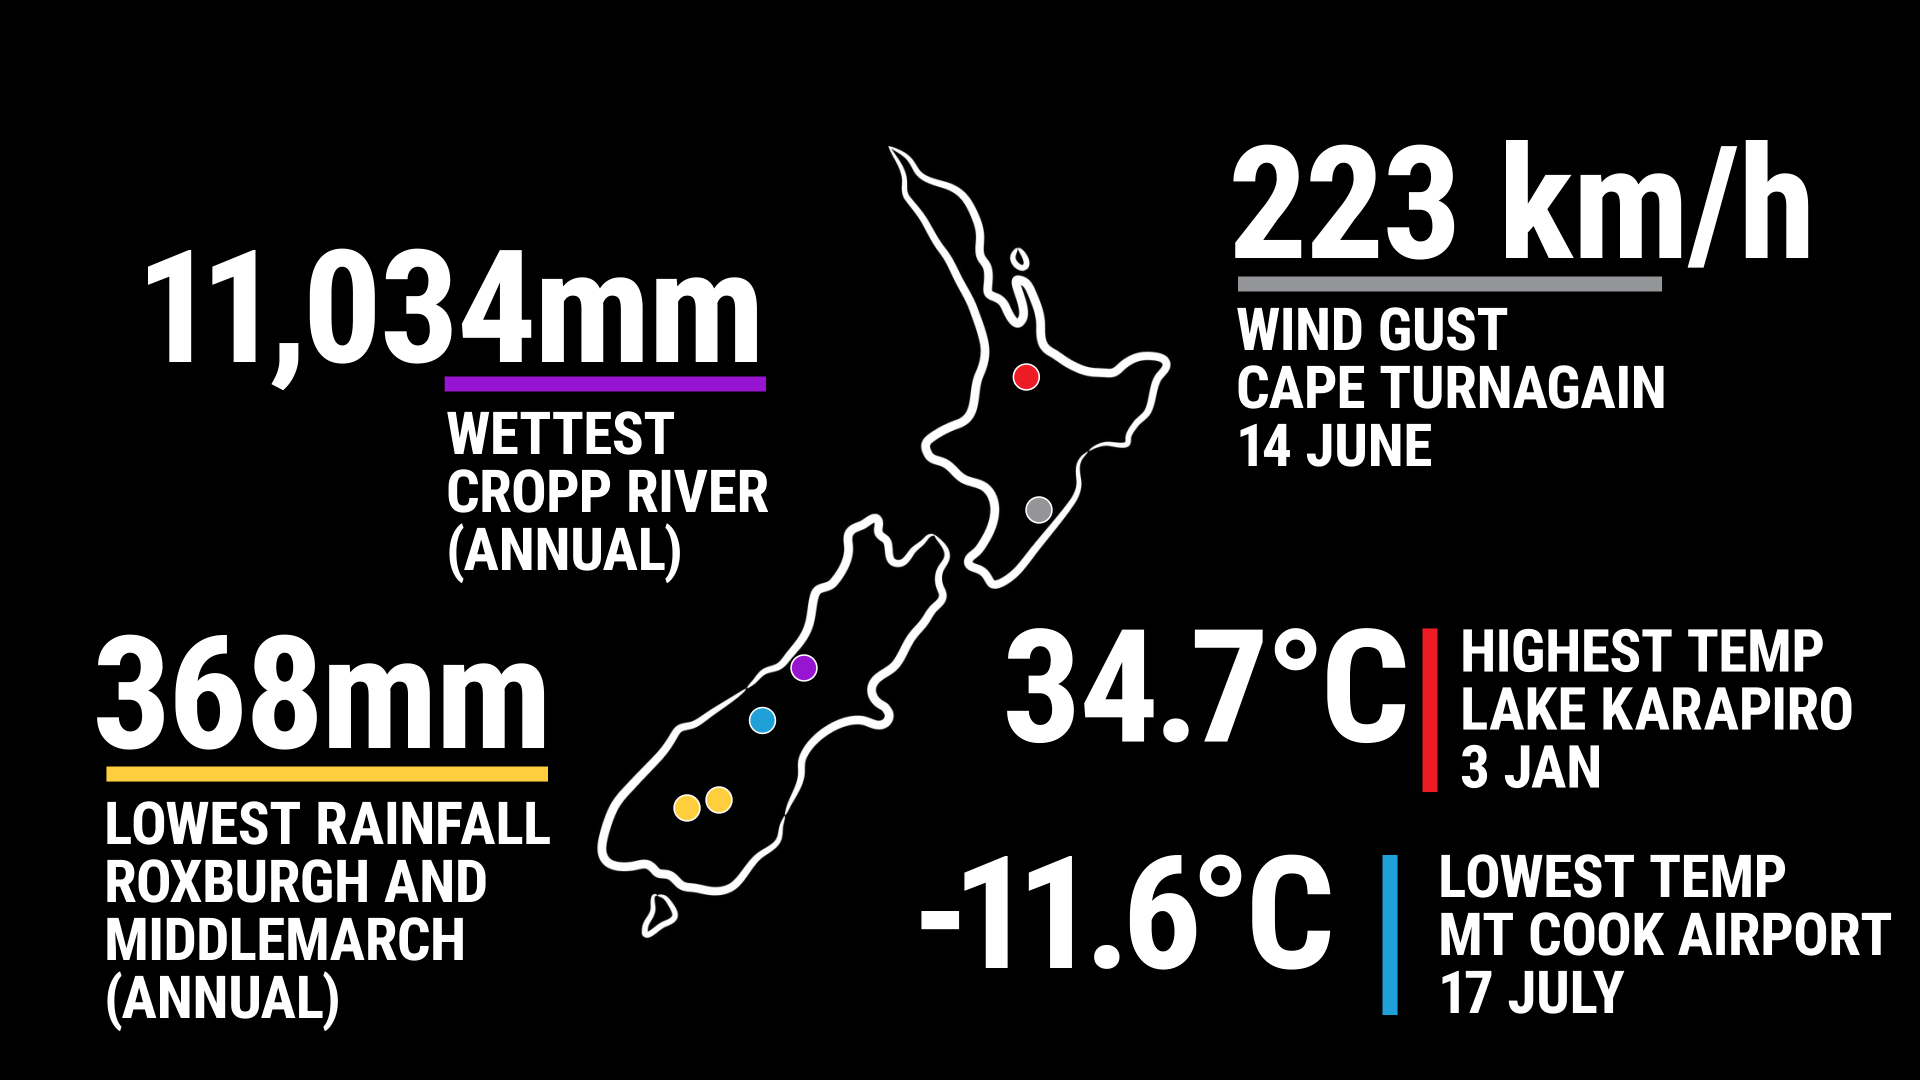
- The highest air temperature was 34.7°C at Lake Karapiro on 3 January and the lowest was -11.6°C at Mt Cook Airport on 17 July.
- Taranaki experienced New Zealand’s highest annual sunshine total with 2659 hours recorded at New Plymouth.
- The wettest location was Cropp River (West Coast, 975 metres above sea level) with 11034 mm rainfall.
- Of the six main centres in 2022, Tauranga was the wettest, Dunedin was the driest and coolest, Auckland was the warmest, Hamilton was the sunniest, and Wellington was the least sunny.
Full report:
Check out the full Annual Climate Summary 2022 at https://niwa.co.nz/climate/summaries/annual-climate-summary-2022