Cyclone Pam’s furious flight path across the South Pacific in March this year illustrated the danger natural hazards pose to life, livelihoods and infrastructural development in the region. Science is helping these rapidly urbanising nations plan for future development that is more resilient to weather extremes.
In the Pacific there are few places to hide from the extremes of nature.
Almost everywhere in the Pacific is exposed to sea, weather and geology: where people live, and where their food, transport and businesses are located.
Cyclone Pam was classed as a category 5 cyclone – the most severe – when it hit Vanuatu on 14 March. Winds gusted up to 320km/h.
Although those in the path of Cyclone Pam had four days’ warning, nothing could prepare their homes and community buildings for the power of the winds.
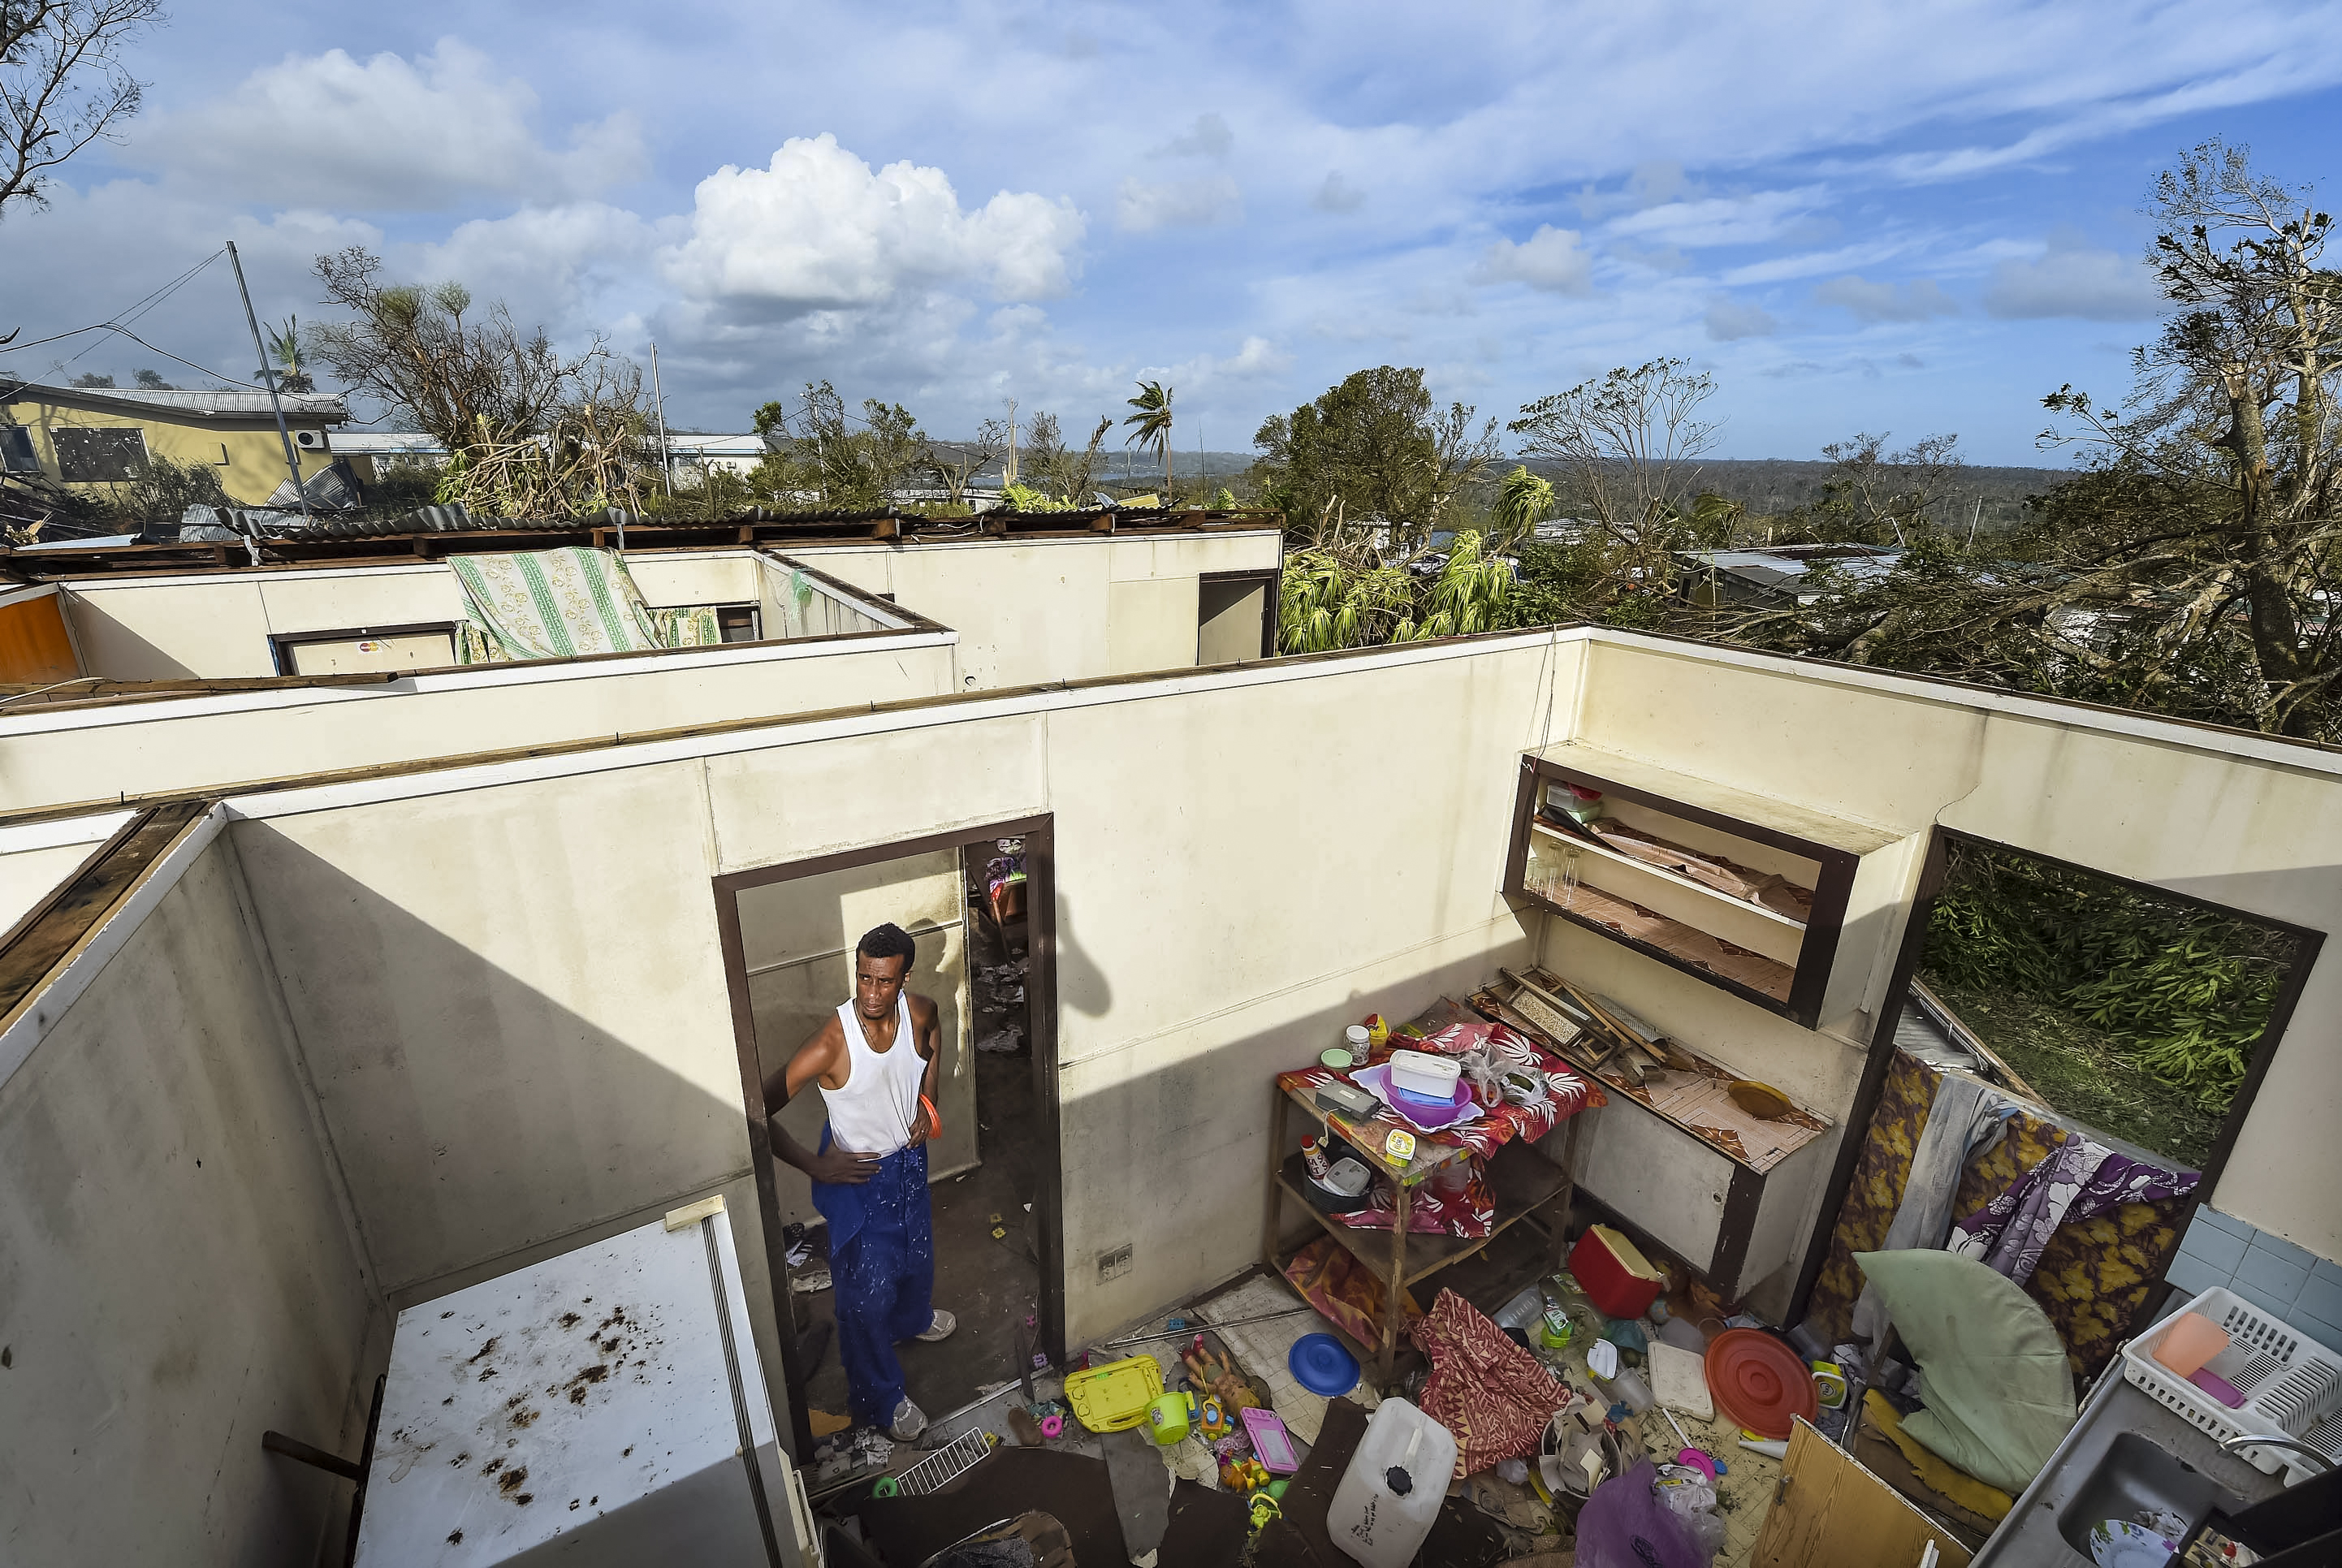
A police officer on Vanuatu’s Tanna Island told Australian Associated Press that police were handing out emergency rations right up until the moment Pam hit.
Officer Eddy Are said they took cover, along with many others, in the few strong buildings on the island. “We just sat there for hours, listening to this bad, dark sound. All of us are homeless now.”
The World Meteorological Organization says the Pacific is the region most prone to natural hazards. Seventy-five per cent of disasters are hydro-meteorological related, with tropical cyclones posing the highest threat and costs in the region.
A 2012 World Bank report found that, of the 20 countries in the world with the highest average annual disaster losses scaled by gross domestic product, eight are Pacific Island countries: Vanuatu, Niue, Tonga, the Federated States of Micronesia, the Solomon Islands, Fiji, Marshall Islands, and the Cook Islands.
The magnitude of these losses is being driven by high population increases and rapid urbanisation in all Pacific Island countries. The total population of the Pacific has trebled since 1960, and the urban population has increased more than five times.
A 2012 Asian Development Bank report on the state of Pacific towns and cities identified that five Pacific Island countries were predominantly urban, with seven having urban populations greater than 40 per cent. Population densities in places such as Betio and Bairiki villages in South Tarawa, Ebeye in the Marshall Islands, and parts of Port Vila and Suva now rival those of Asian cities.
Urban areas in the Pacific have typically developed from colonial centres that have expanded to incorporate surrounding traditional villages. This has led to a mix of planned and unplanned urban development, and a blend of formal and traditional forms of governance. But as rural to urban migration has accelerated, a burgeoning and permanent characteristic of most urban areas is growing squatter and informal settlements (settlements on customary land where land tenure arrangements have been agreed with customary landowners).
Sarah Mecartney, Pacific Programme Manager with UN-Habitat, says up to a third of households in some towns and cities are forced by lack of affordable land to create informal communities in environmentally sensitive areas.
“They live where they can – on low-lying coastal areas and among mangroves, or on steep slopes and on river edges.
“Not only are their houses easily damaged due to materials and construction, the settlements don’t usually have protection such as drainage and earthworks, nor facilities like sewage and power,” Sarah says.
Mecartney says UN-Habitat is seeing improvement from its work helping urban planners undertake vulnerability assessments, risk modelling, and learning from science agencies.
“There is a growing appreciation of the cost-benefits of planning. Risk considerations are now being built into by-laws and regulations, to create more resilient cities,” she says.
Development planning can’t come soon enough. In April last year, heavy rain due to Tropical Cyclone Ita caused some of the worst flash flooding ever experienced in the capital, Honiara, and villages on Guadalcanal. The flooding resulted in 22 people killed, 50,000 affected and an estimated US$107.8 million in damage and losses.
A report by the government of the Solomon Islands identified unregulated urbanisation as a major component of the disaster. About 3000 households, 35 per cent of Honiara’s population, live in informal settlements within and around the city boundary.
Of the 243 houses completely destroyed by the floods in Honiara, most were located on the banks of the Mataniko River. They were largely traditionally built, low-cost, temporary structures on land that had not been subdivided for residential use.
The urbanisation problem is not confined to the Solomon Islands. A 2014 international comparison showed the exposure of urban populations is 40 per cent higher for cyclones than rural populations. In Fiji, for example, the study estimates that risk of floods is 17 per cent worse for urban areas.
After long considering themselves a rural and semi-rural population, Pacific nations now have to work out how to manage urban development. They are planning where to live and build modern infrastructure, how to incorporate formal land-use planning with traditional land ownership mechanisms, and how to design and build to handle their unique environmental conditions.
A major component of the urbanisation challenge is how to develop modern urban economies and societies in the face of extreme hazards, and with very limited resources. Science is a starting point. NIWA has been providing hazard and risk maps to help facilitate stakeholder discussion and long-term planning, and developing tools to enable hazard and climate change considerations to be incorporated into infrastructure design. Armed with this information, island nations are developing more resilient communities, identifying locations where development needs to be avoided or where it can be relocated, and identifying conditions their infrastructure will need to tolerate.
Where and how to build
The Pacific is not on its own in planning urban growth and new infrastructure. International governments and development agencies (such as Australia, the European Union, China, Japan, New Zealand, the World Bank, the Asian Development Bank and United Nation agencies) are directing billions of dollars into the region every year. This assistance has a strong focus on development of basic infrastructure through coordinating mechanisms such as the Pacific Region Infrastructure Facility.
Provision of basic infrastructure is essential, but NIWA’s Manager for the Pacific, Doug Ramsay, also suggests that it can play a critical role in developing community and urban resilience to weather-related natural hazards and the effects of climate change.
“In the face of climate change and the impact of natural hazards on island nations, there is a fundamental need for a rethink on where we build and how we build.
“Strategically located infrastructure can play a major role in this rethink – directing where future development happens and helping facilitate relocation of existing development in highly exposed areas.”
Ramsay is concerned that many infrastructure development and adaptation projects in the region are being implemented with inadequate understanding of the present day weather and climate hazard risks and how these risks may change under future climate change.
He says there is still a large gap in translating climate change science into what it means at a local level for specific infrastructure design conditions.
“There’s potential for under-designed infrastructure, maladaptation and inappropriate strategies being implemented without such information.
“It is critical to ensure natural hazard and climate change considerations are incorporated into decision making because major infrastructure has a long lifespan. It is difficult and costly to ‘climate-retrofit’ once such infrastructure is in place.”
NIWA is developing risk-based information to assist planning, and developing tools to provide information required for infrastructure design.
A series of ‘calculator’ tools have been developed to support infrastructure design. These started in Kiribati in 2008, under phase two of the Kiribati Adaptation Project, and more recently in Fiji and the Cook Islands.
Calculators have been developed to provide extreme rainfall intensity design information for flooding, stormwater and drainage design; drought assessment to aid water resource management; and sea-level and wave assessment for coastal engineering design and coastal hazard planning.
Ramsay says the key was to develop easily applied, pragmatic but scientifically robust tools.
“The calculators are based on the ubiquitous Excel spreadsheet, which makes it easy to install, use and adapt.
“They have been developed around a common format, but are customised for the particular need.”
To make it even easier for users, an interface has been built for the spreadsheet. Users make choices related to the type of project and the sort of guidance they need, and input data such as measurements specific to the location.
With the click of a button, the spreadsheet produces a range of design extreme conditions typically required by engineers, with the potential changes in these conditions over the design’s potential lifetime due to climate change clearly defined.
Ramsay says the spreadsheet format means the calculators can be effortlessly modified to new uses.
“It’s easy to pick up how these calculators work and local engineers have quickly grasped their use and application.”
Climate-proofing Mangaia
The calculator proved its worth in assisting the island of Mangaia in the Cook Islands to incorporate climate resilience into future development planning for the main village of Oneroa and strengthening of Avarua Harbour.
Mangaia is the southern-most island in the Cook Islands, 206km southeast of Rarotonga and home to almost 600 people.
A coastal version of the calculator was specifically developed as part of the Mangaia component of the Pacific Adaptation to Climate Change (PACC) project launched in 2009. This was an effort by 14 countries, with coordination from the Secretariat of the Pacific Regional Environment Programme (SPREP) to enhance the capacity to increase resilience and reduce vulnerability to the adverse effects of climate change. The Cook Islands was one of four PACC members to identify coastal zone management as a priority.
Infrastructure Cook Islands Acting Director of Civil Works, civil engineer Paul Maoate, was appointed to manage the project.
Maoate believes the Cook Islands Coastal Calculator has revolutionised the country’s ability to build infrastructure along its coastlines that is resilient to the impacts of climate change.
“We now have a tool that can incorporate sea-level rise projections over time, takes into account possible changes in cyclone intensity, storm surges and waves, and delivers the coastal extreme water levels and wave conditions we need to design coastal infrastructure,” he says.
In February 2005, Mangaia was blasted by four cyclones that caused extensive coastal damage, and delayed shipping to the island.
Cyclone waves overtopped the harbour, filled more than 4km of coastline with debris, damaging roads, the main village of Oneroa, and the western half of the airport. After the harbour was damaged, many locals had to resort to airfreighting their cargo. Building a more resilient harbour facility was a priority for the Mangaia community.
The first step was to gather coastal-related data on Mangaia’s coastline. The government worked with NIWA and the Secretariat of the Pacific Community’s Oceans and Islands Programme in the Applied Geoscience and Technology (SPC-SOPAC) Division.
“A detailed survey of the harbour, airport, and town area mapped the terrain, with some tide and wave data also collected,” says Maoate.
“The calculator was developed in spreadsheet form, making it easy for us to use and update. It incorporates extreme wave and sea-level data and factors in the predicted climate changes of sea-level rise, swells and an increase in the intensity or number of future cyclones for Mangaia.”
Different scenarios were developed to assess how changes in climate and sea level would change extreme wave and water levels affecting the harbour so this could be incorporated into the rebuilding activities. NIWA also looked at how the frequency, magnitude and extent of coastal inundation in Oneroa village may change over the next one to two generations.
NIWA's Doug Ramsay and coastal scientist Dr Scott Stephens assisted with the calculator, training in its use, and translating the information.
Ramsay says the close relationship with Cook Islands engineers and the community on Mangaia was essential to the success of the project.
“We spent a couple of days training the engineers in the use and application of the calculator, and a few more with the engineers and Mangaia community working through the calculator’s results and implications. This provided many ideas on how the tool could be improved, which we incorporated.
“Establishing credibility of the calculator with the Mangaia community was vital. With community members, we mapped where waves reached in the village during the three most severe cyclones that were experienced in living memory. Using the calculator, we estimated how far into the village waves would reach for these cyclones. There was a very good match between what had been observed by the community and what the calculator suggested.
“We then explored with the community where damage could occur in the village under future cyclone events exacerbated by sea-level rise and climate change impacts. Very quickly we could see which parts of the village, which community assets and buildings, could be impacted.”
Ramsay says the information meant the Oneroa community could decide what they needed to move, strengthen or accept could be damaged over the next 50 years.
“Armed with information, the decisions are in their hands. They decided on the time frame over which they felt they could make adjustments, what their priorities were, and what assets they needed to protect. Over the next few generations they plan to gradually adjust their village to adapt to the increased potential of wave damage due to future cyclones.”
Maoate says the projections from NIWA’s hazard calculator, and the decisions of the Mangaia Council, fed into the project to build a new wharf.
“The island has no natural harbours or lagoons, and the energy of waves along the coast is quite strong because the geology of the reef is very steep. The Coastal Calculator told us the design conditions to enable us to increase the wharf’s concrete slab thickness in order to prevent it from being damaged by future storm waves. We also increased the reinforcing and constructed it using isolated pads to mitigate future damage.”
The new slipway, made of thicker reinforced concrete, was relocated to a sheltered area away from the harbour entrance to enable fishermen and the cargo barge to safely launch and land. The harbour channel was also widened to 30m and the depth of the entrance increased to 4m.
Maoate says the structural changes have made the harbour entrance safer to navigate, by reducing the wave set-up in the channel, and increased the overall strength and durability of the port area.
Mangaia’s Mayor Tere Atariki says shipping is now safer and there are fewer delays.
“There have been real benefits in terms of freight shipped from Rarotonga. It’s sheltered now. Previously, it was more open to the elements. In the past, cargo was often damaged before it was landed, and this was a frustrating loss for importers.
“Fishermen have been quite happy with the changes too, especially the new slipway. Strong currents at the old slipway site made it very dangerous to use at times,” he says.
Atariki says initial designs never considered making the harbour climate resilient.
“The first design was lacking – there was nothing to prevent it from being destroyed all over again. The data gathered by the scientists and engineers through the PACC project helped us make the right improvements.”
Oneroa shop owner Babe Pokino says he’s been impressed with the upgrade, including the new sections of seawall on either side that allow better protection from waves.
“We get a ship in twice a month on average, and we don’t have to worry so much about it waiting for days outside the harbour or turning away because of rough seas. The wharf is more spacious and cargo can be offloaded much faster from the barge.”
In addition, the project has led to the development of an integrated coastal management policy framework and implementation plan for Mangaia.
Maoate says a cost-benefit analysis carried out late in the project highlighted that strengthening harbour structures to cyclone forces is more efficient when it is designed and built from scratch, rather than a retrofit.
“With retrofits there are always some unknowns that may pose a risk to the overall strength of the structure.”
Since the project’s completion, the government has adopted a policy that all new coastal infrastructure projects be climate-proofed.
The calculator was not just developed for Mangaia; it can be applied to any of the 15 islands in the Cook group.
“We are already finding new applications for the Coastal Calculator. It will be adapted for use in the upgrades to harbours in the northern group islands of Manihiki, Rakahanga and Penrhyn due to begin this year,” says Maoate.
Fiji floods
Fiji is one of the most urbanised nations in the South Pacific – 52 per cent of the population live in urban areas. This is growing by 1.5 per cent every year.
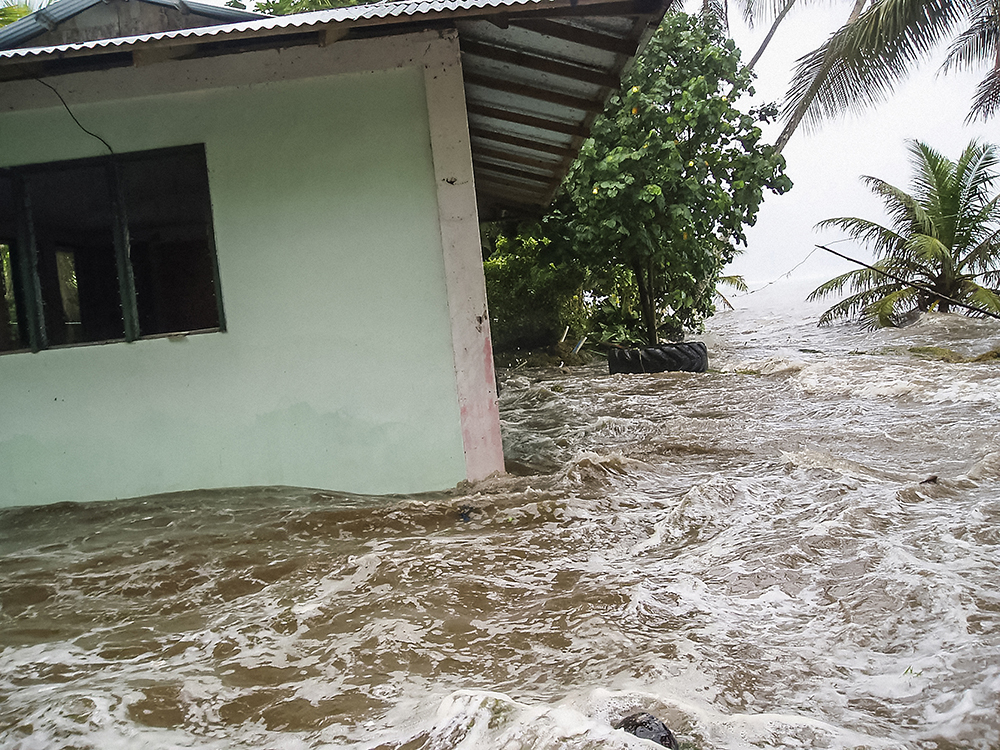
In January 2009, Fiji was hit by devastating floods. The water claimed 11 lives, left 12,000 people temporarily homeless and caused more than NZ$70 million of damage.
In March 2012, torrential rain again caused flooding that affected more than 150,000 people, with four deaths.
One of the areas most at risk is Nadi, the main gateway to the country for tourists. The high rate of urbanisation, as people move from rural areas in search of jobs in the tourism industry, has collided head-on with the region’s climate. Development pressures, particularly informal settlements in the peri-urban areas surrounding the town, are pushing people into evermore flood exposed locations. A UN-Habitat report in 2012 said, “Floods are the principal hazard as a result of the town’s topography, mangrove deforestation, and up-river agricultural and catchment management practices.”
In recent years the nation has come to grips with the flood risk and development challenges facing Nadi, with a number of inter-related projects aimed at reducing the impacts. NIWA has been part of this effort on a number of fronts, including recently completing the Nadi River Flood Risk Project with the Applied Geoscience and Technology Division (SOPAC) of the Secretariat of the Pacific Community (SPC), with funding by the World Bank.
NIWA Christchurch Regional Manager Charles Pearson says they used computer modelling to assess flood events in the Nadi river catchment, including simulating the 2012 flood.
He says increasing development of land within flood plain areas exacerbated the risk of flood disasters. So NIWA simulated flood events to help Fiji plan flood mitigation measures.
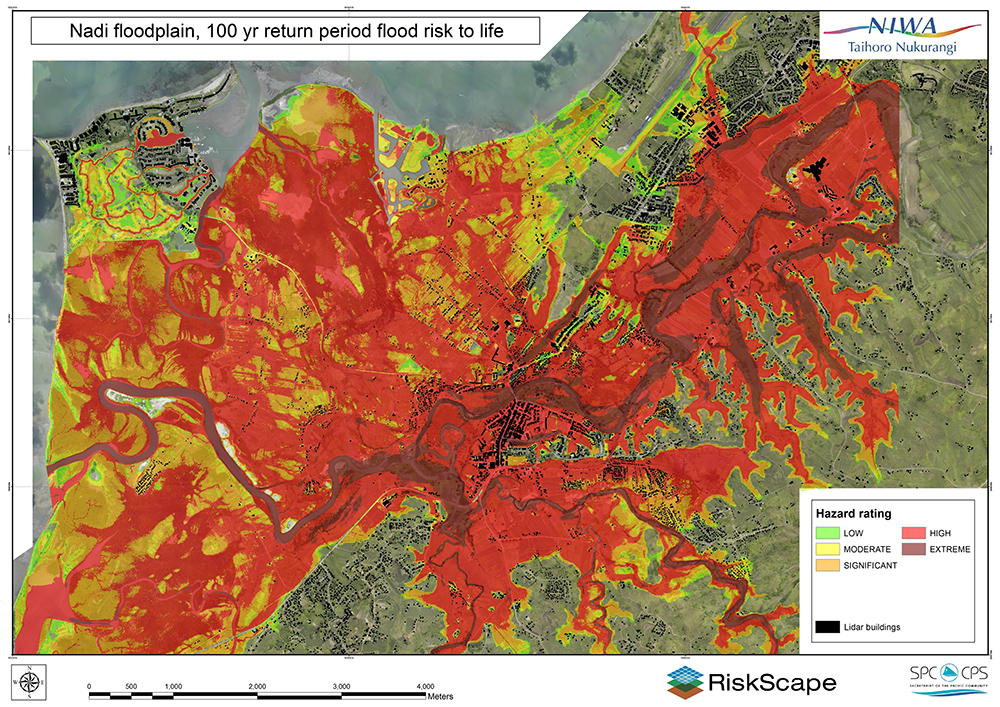
Pearson’s team used topographic data from high-resolution LiDAR (airborne laser scanning), hydraulic inundation models (computer flow simulations) and risk models (combining hazards and assets). Flood inundation maps were developed, from which economic damages and human losses for the Nadi flood plain area were calculated.
“The model has been able to create maps showing the impact of large flood events on the flood plain,” says Mr Pearson. “As well as being able to assess flood warning and evacuation procedures, the modelling helps manage urban development planning.”
The study showed that under most flood events, the delta from Nadi township to the ocean would be under water. There would be significant loss of life and damage to infrastructure. Initial assessment of potential mitigation options, such as a flood diversion channel, indicated that, while some of the flood exposure could be reduced during large floods, it would not solve the flooding problem.
The flood model information is now being used in a subsequent NIWA-led project working with Nadi Town Council and the Department of Town and Country Planning within the Fiji Ministry of Local Government, Housing and Environment. The town is one of two demonstration studies in a regional project funded by the Asian Development Bank to develop tools and processes to better incorporate flood hazard considerations into urban and infrastructure planning.
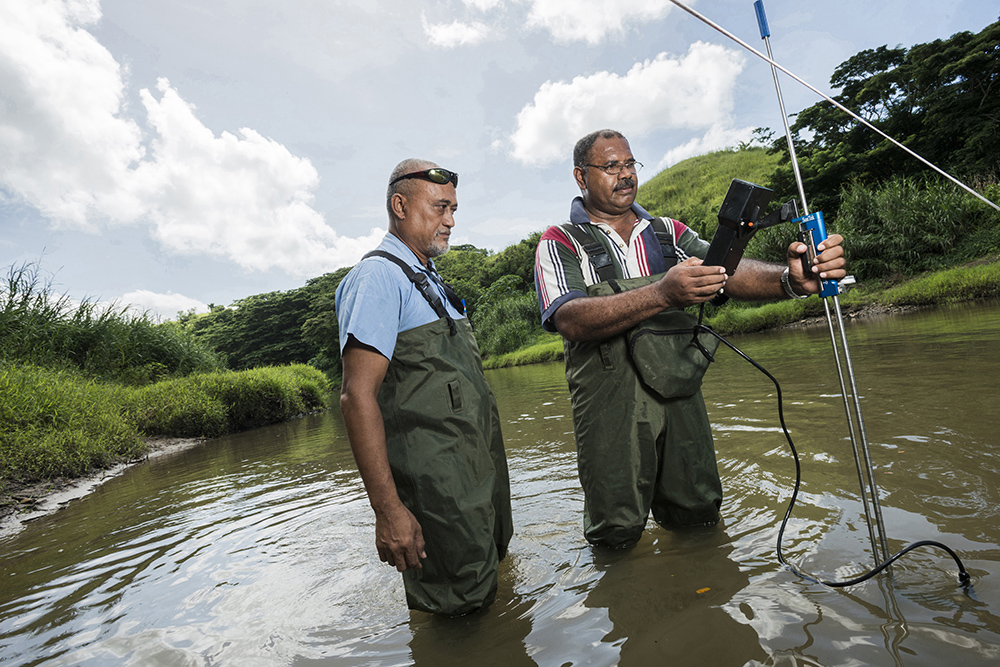
The work builds on earlier support NIWA provided as part of the Nadi component of the regional Integrated Water Resource Management (IWRM) project, coordinated by SOPAC (now SPC). This established a network of rain gauges and river flow monitoring stations in the Nadi catchment that transmit data back to Fiji Meteorological Service to form part of an early warning system.
Pacific IWRM project manager Vinesh Kumar said NIWA’s approach to its involvement in the Nadi project has made a difference.
With a large upper catchment of 500km2 posing a major flood risk for the downriver Nadi township, an effective early warning system was vital to protect life and property.
“We wanted to see how best we could get that [flood] information to see how we could improve the warning system,” says Mr Kumar.
“We didn’t want to bring in something that was a one-off, and we didn’t want to bring in consultants just to put in one thing but not to the level of the local capacity.
“The way we wanted to approach this issue was to have a component of sustainability and process throughout. We were looking long term, as well, so if the system becomes obsolete we can see how to upgrade it.”
Mr Kumar said NIWA was the perfect partner.
“When we engaged with a few companies and went through the process, we found that NIWA had the best options. NIWA also had a good reputation among other stakeholders.”
Resilience pathways
Cyclones, or typhoons as they are known in the northern Pacific, have long played a role in influencing development patterns.
Over 600 years ago, the islanders of Kosrae, the eastern-most island in the Federated States of Micronesia, commenced construction of Lelu, which was to become the centre of settlement for the rulers of Kosrae for the next 400 years.
The settlement consisted of 100 prismatic basalt walled components reclaiming an intertidal area of reef some 20ha in size. A typhoon sometime in the AD1400s that deposited sand and coral rubble is thought to have created the base for the development at Lelu. Another in the 1790s damaged Lelu, starting its demise as a settlement.
The majority of the population traditionally lived on the lower slopes of the volcanic parts of the island, but above areas impacted by coastal flooding or erosion. Since the mid-1850s, the main villages and all Kosrae’s infrastructure have developed on a narrow strip of land around the coastline, built up by cyclone and storm deposits.
The last typhoon to devastate Kosrae was in 1905. However, warnings of the vulnerability of Kosrae’s development occur on a frequent basis. Significant high tide flooding and wave overwash of where people live now happen almost annually.
Almost 90 per cent of locals report having experienced coastal erosion, and over half of them have lost property and income due to extreme inundation.
Kosrae has realised that, in the face of climate change, the present development pathway is unsustainable. Kosrae’s Governor the Honourable Lyndon Jackson said, “We acknowledge that many of the approaches we presently use to manage the impacts of these hazards on development and our communities will be increasingly ineffective or unaffordable as sea levels rise.”
So Kosrae, with support from NIWA, has set out an adaptation plan for the next two generations. Called the Kosrae Shoreline Management Plan, it develops a range of inter-related adaptation activities.
Fundamental to the plan is strategic relocation of infrastructure over the next one to two generations. This will act as a guiding mechanism to assist the gradual relocation of people currently living in areas highly exposed to coastal hazards, back to the locations on the lower parts of the volcanic part of the island where their ancestors had originally settled.
Ramsay says infrastructure can create an enabling environment.
“Communities generally develop around where infrastructure is located. By starting the process now and implementing over generational time frames, relocating infrastructure can be done in an affordable and manageable way, without people feeling threatened by the thought of relocation. As people build new properties, businesses and assets, development on safer, less exposed areas can happen gradually.
“Relocation is always a difficult thing to discuss, particularly in the Pacific where land has such cultural standing. The important thing is to let people take control by starting the conversation, offer hope, creating an enabling environment, expanding their comfort zone and providing time.
“The hope is that Kosrae’s communities can build resilience through a different development pathway, rather than being forced by a severe typhoon striking the island, as their chiefs were on Lelu in the late 1800s, or as the consequences of climate change and sea-level rise really begin to bite.”
The cost of natural hazards
Since 1950, natural disasters have directly affected more than 3.4 million people and led to more than 1,700 reported deaths in the region (outside of Papua New Guinea).
Ten of the 15 most extreme events in the region reported over the past half-century occurred in the last 15 years.
The number of hurricane-strength cyclones has increased in the southwest Pacific in the past 50 years, with an average of four events now occurring each year.
The cycle of natural disasters seriously retards economic development of the South Pacific. Exactly how much the Pacific is set back is largely unknown, because there are few resources to assess economic impacts of each disasters.
A SOPAC statistical summary of hydro-meteorological disasters in the Pacific (February 2014) found that, while the cost was estimated at NZ$5.2 billion, “the cost of these disasters is massively understated”. It said 44 per cent of all recorded disasters have no value costs recorded with them.
The damage and losses from the 2014 Honiara floods were equivalent to 9.2 per cent of gross domestic product (GDP) for the nation. The sectors most damaged were urban and infrastructural: housing and transport, accounting for 56 per cent and 23 per cent of damage, respectively. Economic losses were highest for the mining sector (50 per cent of all losses) and agriculture (31 per cent). As a result, the Solomon Islands Government expected growth to be negative 1.1 per cent that year.
Fiji is the most prone in the region to hydro-meteorological disasters. The costs of these over the 30 years to 2012 was NZ$1.6 billion.
The Fiji floods in 2009 caused about NZ$5 million in humanitarian costs – the impact on people. But the greatest costs – NZ$24 million – were incurred by the nation’s sugar industry. The floods were debilitating; 150,000 tonnes of production were lost. Repair was needed to fields, buildings, equipment and roads. This takes time and money, which lowers production over the medium term and sets back long-term industry development.
Reporting from Mark Blackham (New Zealand), Helen Greig and Rachel Reeves (Cook Islands).