Water resources in spring 2003
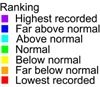
River flow
River flows for spring were normal or above normal for most of the North Island, the top half of the South Island, and Fiordland. Flows were below normal in the Bay of Plenty, coastal Nelson, Otago, and Southland, and were especially low in Central Otago.

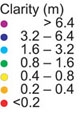
Water clarity
In general, water clarity was normal or higher than normal over much of the country, except for some rivers in Auckland, Waikato, Hawke’s Bay, and Canterbury, where clarity was unusually low.


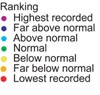
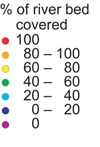
Slime index
The new ranking map (left) puts the latest slime index map (right) into historical perspective. The slime index was low over most of the country, which is usual for this time of year. However, rivers in Taranaki, Manawatu, and the upper West Coast had much higher slime indices than usual. It is not known yet whether this is part of a continuing trend, but autumn and winter values for 2003 in Taranaki and Manawatu were also unusually high.


Water temperatures
Stream temperatures were normal or a little below normal over most of the country, but were about a degree warmer than usual in both the south and west of the North Island and parts of Otago and Southland.


Lake levels
Most of the monitored lakes were close to normal levels, except for Lake Waikaremoana in the Bay of Plenty and Lake Wahapo on the West Coast, which had above normal levels. For many lakes, the levels are a reflection of recent weather. However, for lakes that are managed for uses such as hydroelectric power generation or irrigation, the levels also depend on how the lake is managed. For example, water can be stored when inflows are large, and released later, when demand is greatest. Exactly how this is done depends on the timing of the inflows, the patterns of demand for water, and the operating rules for managed lakes.

This page summarises a variety of water resources data for the period June to August 2003. Note that the data are preliminary, and subject to amendment after quality assurance procedures. We thank NIWA field teams, regional and district councils and hydro-power companies for providing this information. We hope to expand the coverage with contributed measurements using standard methods at long-term sites.
For information on hydroelectricity storages, see COMIT Free To Air (www.electricityinfo.co.nz/comitFta/ftaPage.main).
Groundwater
Groundwater levels in New Zealand showed the usual seasonal declines heading towards summer 2003–04. Groundwater levels for most of the country were generally average for spring. Eastern South Island indicator wells were generally lower than is typical for this time of year, with low levels in Otago and parts of Southland caused by lack of winter recharge. The Canterbury area between the Ashley and Waimakariri Rivers generally had average groundwater levels. Groundwater levels in the North Island and top of the South Island were generally higher than in the corresponding period in 2002 and thus those places generally had more storage at the start of the summer irrigation period than in the previous year.

Groundwater information is supplied by the Institute of Geological and Nuclear Sciences Ltd.