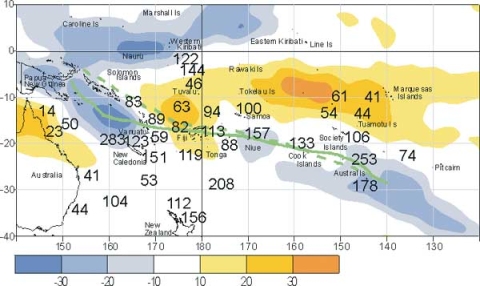
Climate developments in March 2002
Active convection over equatorial waters about and west of the date line
High rainfall in parts of New Caledonia and southern French Polynesia
Low rainfall from Tuvalu to northern French Polynesia
An extensive area of enhanced convection occurred over equatorial waters about and west of the date line, from Papua-New Guinea to Western Kiribati, with another convective band associated with a southward displacement of the SPCZ extending from the northern Coral Sea southeast to affect Vanuatu and New Caledonia. The SPCZ was situated near its average position about and east of the date line, but was more active than usual over southern French Polynesia (where wet conditions continued). Rainfall was at least 125% of average at many locations within these convective regions, but more than 200% of average in parts of New Caledonia and southern French Polynesia, some sites recording more than 400 mm. Rainfall totalling more than 100 mm was measured in many parts of New Caledonia during the passage of tropical cyclone ‘Des’ to the southwest from 5 through 7 March. Aoupinié recorded 275 mm on 6 March and 390 mm in two days. Some flooding occurred although not major. Further high rainfall (at least 100 mm) also occurred in northern and eastern parts of New Caledonia from 14-15 and 22-24 March.
High March rainfall was recorded at:
| Country | Name | Rainfall, mm | % of average | Comments |
|---|---|---|---|---|
|
New Caledonia |
Ile Art, Belep |
612 |
283 |
Highest, records began in 1962 |
|
New Caledonia |
Ouanaham |
492 |
209 |
Very high |
|
New Zealand |
Raoul Island |
306 |
208 |
Very high |
|
French Polynesia |
Tubuai |
574 |
253 |
Highest, records began in 1953 |
Low March rainfall was recorded at:
| Country | Name | Rainfall, mm | % of average | Comments |
|---|---|---|---|---|
|
Fiji |
Matei Airfield |
44 |
4 |
Lowest, records began in 1957 |
Sunny conditions, with less than 75% of average rainfall, prevailed over northern Fiji, much of Tuvalu, Tokelau and many islands in northern French Polynesia. Below normal rainfall (less than 50% of average) continued on the Queensland coast of Australia, extending into the western Coral Sea. Willis Island, off the Queensland coast, has now recorded 8 consecutive months with less than 75% of average rainfall.
High mean March air temperatures (1.0°C or more above average), associated with warmer than average sea surface temperatures, were measured in Fiji and northern and central French Polynesia. Air temperatures were near average in New Caledonia.
Unusually high mean March air temperatures were recorded at:
| Country | Name | Mean air temperature, °C | Departure from average | Comments |
|---|---|---|---|---|
|
Fiji |
Rotuma |
28.6 |
+1.5 |
Highest, records began in 1948 |
|
Fiji |
Nabouwalu |
28.5 |
+1.9 |
Highest, records began in 1956 |
|
Fiji |
Ono-I-lau |
27.6 |
+1.7 |
Extremely high |
|
French Polynesia |
Bora Bora |
29.5 |
+1.6 |
Highest, records began in 1976 |
|
French Polynesia |
Rikitea |
26.5 |
+0.8 |
Highest, records began in 1981 |
Extreme March air temperatures were recorded at:
| Country | Name | °C | Comments | |
|---|---|---|---|---|
|
French Polynesia |
Hao |
Extreme daily maximum |
32.9 |
Highest, records began in 1965 |
|
Fiji |
Viwa |
Highest overnight minimum |
28.3 |
Highest, records began in 1980 |

