Henderson Creek experiment - extract of 5 days of data
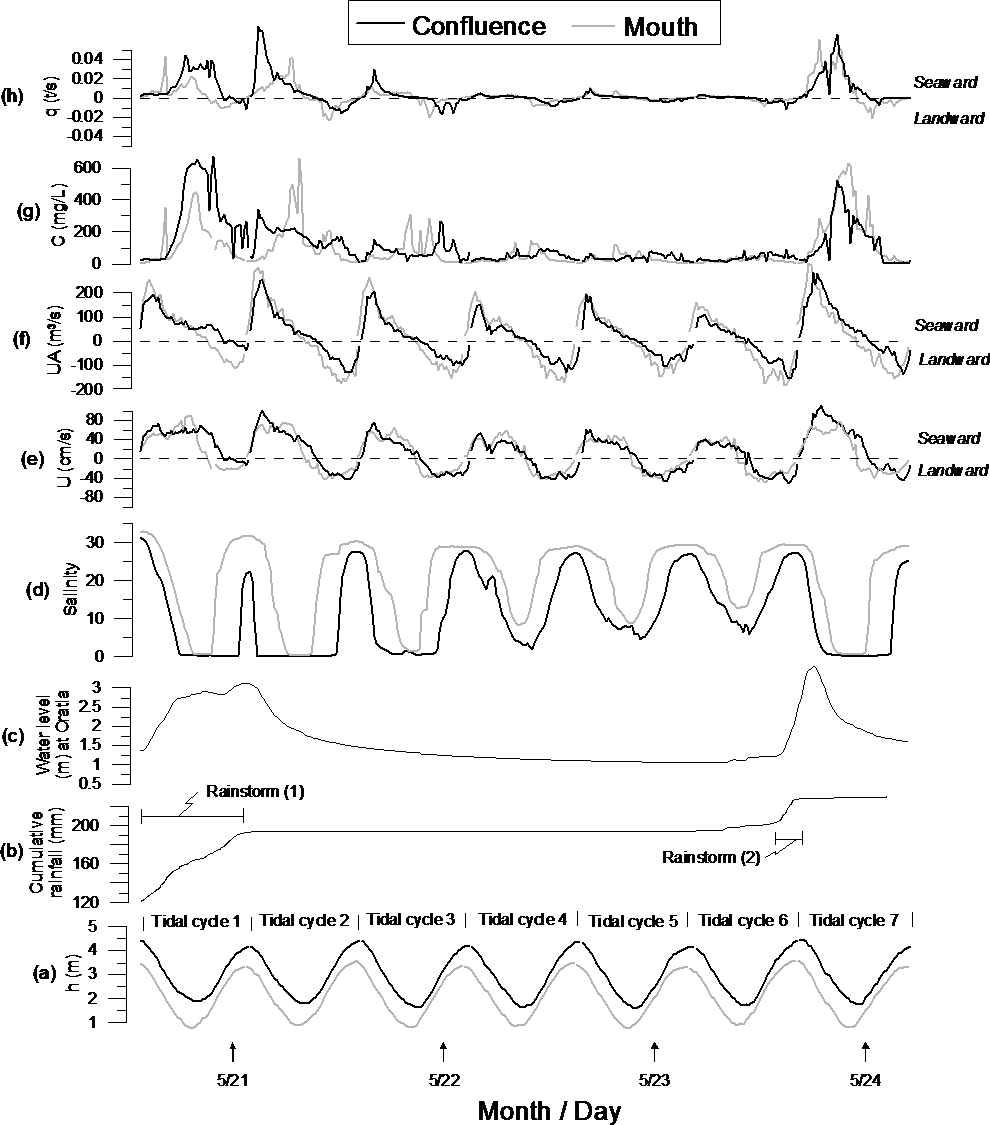
An extract of about 5 days of data from the Henderson Creek experiment, showing what happens in a rainstorm and in the aftermath of a rainstorm. Data from the two measurement stations are shown: station Confluence is at the head of Henderson Creek, and station Mouth is at the mouth of Henderson Creek. Panel (a) shows the tide at both stations. There is about 12 hours between successive high tides (and low tides). Panel (b) shows cumulative rainfall in the catchment. Notice that some 80 mm of rain fell in 12 hours on May 20. Panel (c) shows freshwater runoff to the head of Henderson Creek; the runoff increased during the rainstorm on May 20, and quickly subsided when the rain stopped. Panel (d) shows salinity. Notice that, at low tide when it was raining, salinity was zero at both stations, which indicates that Henderson Creek had essentially turned into a freshwater river. The longitudinal salinity gradient re-established soon after it stopped raining. Panel (g) shows sediment transport through each station, where positive denotes seaward transport and negative denotes shoreward transport. During the rainstorm, transport was strongly seaward at both stations, which indicates that sediment delivered to the head of the creek by freshwater runoff was being flushed through Henderson Creek and into the wider Central Waitemata Harbour. After the rainstorm, sediment transport reduced and turned around into the tidal creek, reflecting the return to, and sequestration in, the tidal creek of sediment that was flushed into the harbour during the preceding rainstorm. Panels (e), (f) and (g) show current speed, water flux and suspended-sediment concentration, respectively.