Rob Davies-Colley
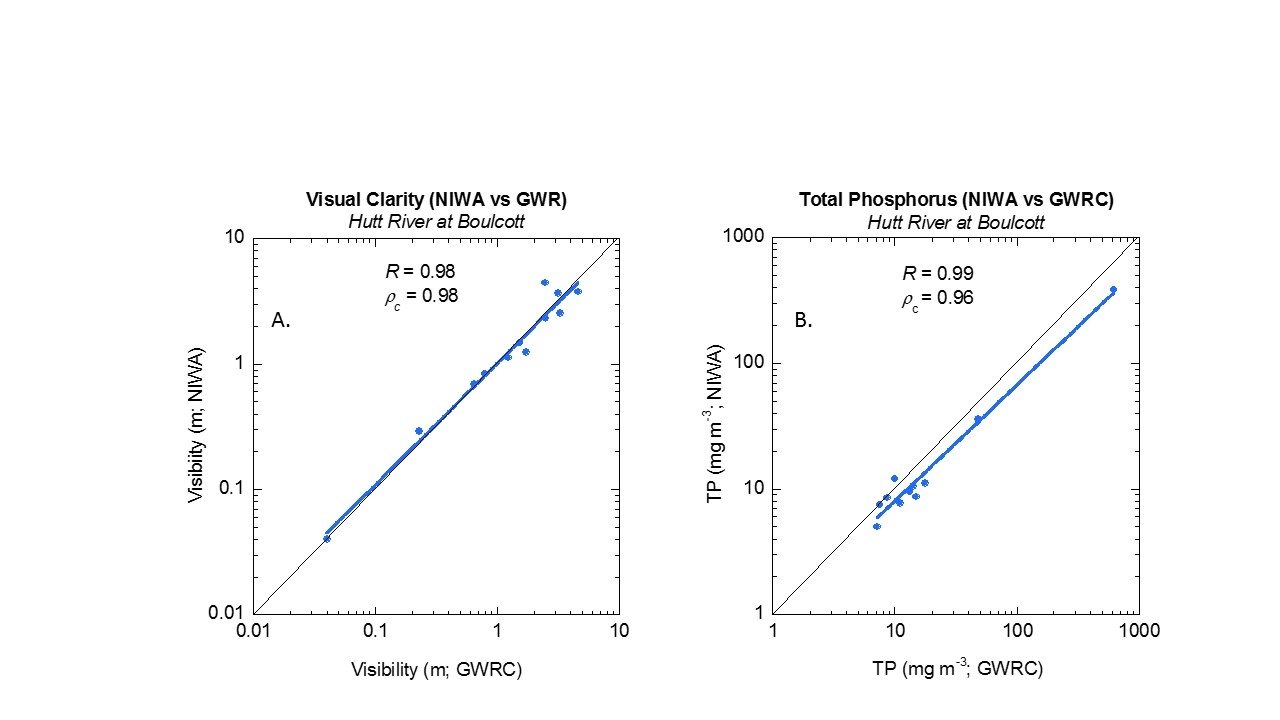
Figure 1: comparison of inter-agency paired water quality data for visual clarity and phosphorus. R is Pearson’s correlation coefficient. pc is Lin’s concordance correlation coefficient – which measures closeness to the 1:1 line of perfect agreement rather than closeness to the regression line.

