This service (updated daily) uses sea-level data streams from:
- NIWA
- regional councils (Northland Regional Council, Waikato Regional Council, Greater Wellington Regional Council, Environment Canterbury)
- territorial authorities (Tasman District Council)
- port companies (Port Taranaki, Primeport-Timaru, Port Lyttelton)
- Antarctica NZ
- Bureau of Meteorology (Australia).
-

Green Island
Data source – NIWA
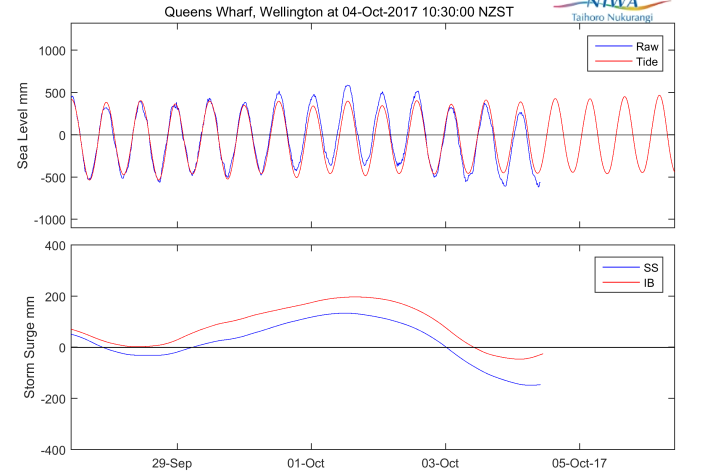
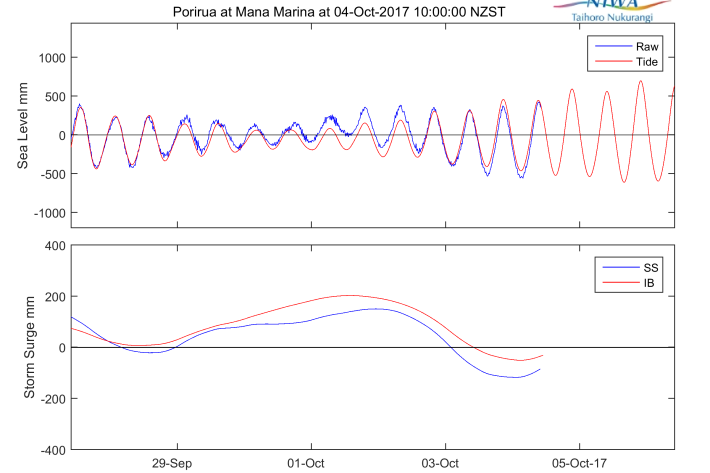
Latest data The upper plot compares raw data (blue) and forecast tide (red). When the two curves are aligned there is no storm surge, which is the elevation or depression of sea level as a result of meteorological conditions. But if the raw data lie above or below the forecast tide, it means we have positive or negative storm surge. The lower plot compares storm surge (SS) with inverted barometer (IB), which is derived from atmospheric pressure. When the two curves are aligned it means that the storm surge is being driven by local pressure changes.


