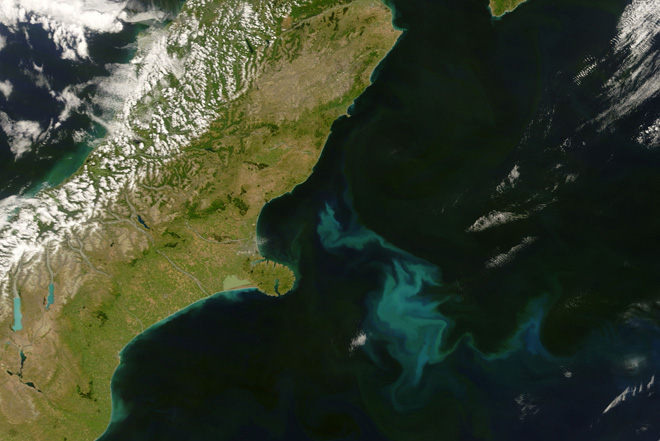
Satellite images can be used to measure phytoplankton biomass in the ocean around New Zealand in order to understand ocean ecosystems, fish populations and greenhouse gas absorbtion.
The problem
Phytoplankton is the bottom of the food chain in the ocean, indirectly supporting the entire fish population. Its photosynthesis also absorbs an enormous amount of CO2. Understanding how much phytoplankton there is and how it behaves is important for planning sustainable fishing and also for predicting future levels of greenhouse gases in the atmosphere. However, the ocean is huge and the only effective way to observe phytoplankton biomass is via satellite remote sensing.
The solution
This project, funded by FRST, is about calculating the concentration of phytoplankton biomass as accurately as possible in New Zealand waters. Images of the ocean around New Zealand from space can be tuned using ocean colour algorithms to act as biomass maps. These maps, produced roughly once a week, can be used to calculate how fast carbon is being taken up by phytoplankton photosynthesis. These data will feed into other studies, such as fisheries and carbon sequestration.
Ten year records of remotely sensed ocean colour data are now available from NASA. These data are being acquired and processed into reflectance spectra. NIWA is gaining as much information about phytoplankton as possible from these data in several steps:
- find out how many 'colours' are present at different times and locations in the New Zealand EEZ, using the remotely sensed data
- characterise the phytoplankton types optically, using ship-based surveys
- radiative transfer modelling can show how much of the variability in phytoplankton types that we can measure from ships is also discernable in the satellite data
- finally, the first 3 steps are combined to give maps of phytoplankton type and biomass roughly once per week (cloud-dependent).
This requires a great deal of information from ship survey optical measurements to validate the satellite data and processing time to work the remotely sensed data into meaningful units.
The result
Stage 1 has just begun.