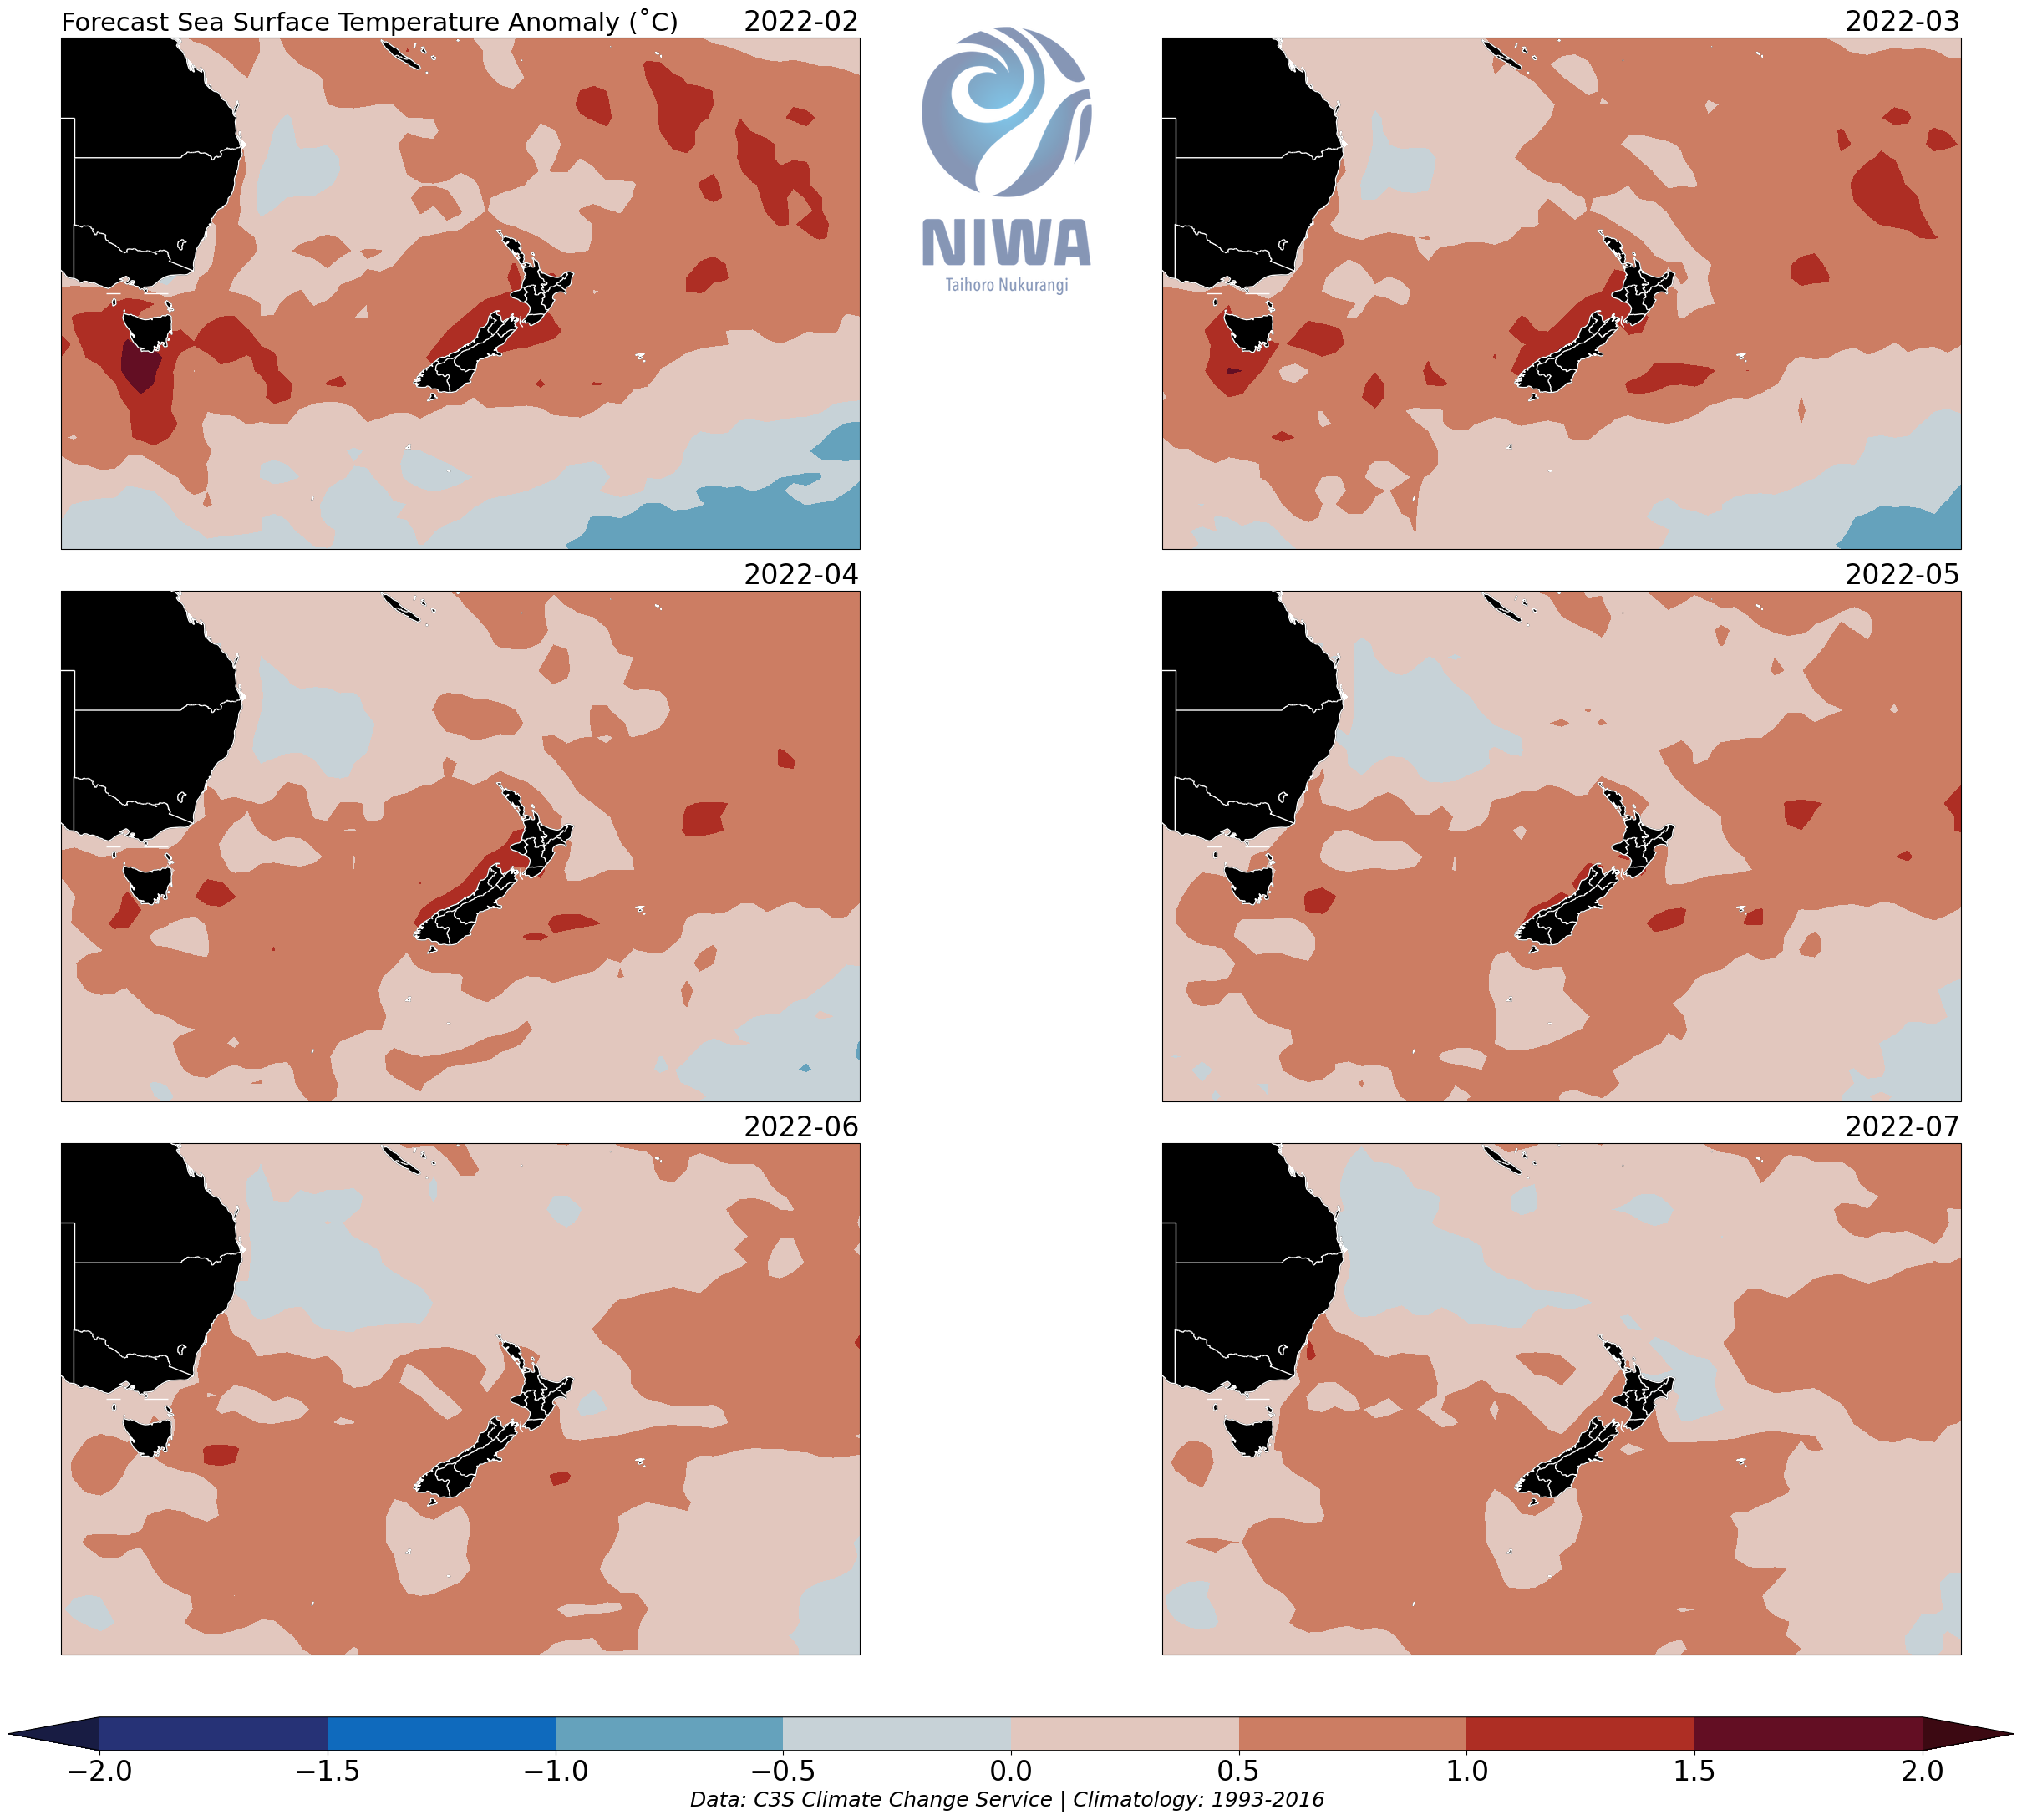
Forecasting sea surface temperatures several months in advance is challenging. To give us insights into what might happen around Aotearoa New Zealand in the months to come, NIWA scientists have combined predictions from eight different climate models from institutes around the world.
Amid a changing climate, global sea surface temperatures are increasing. This will be associated with more frequent and intense marine heatwave events (which are defined as being an extended period of extremely warm ocean temperatures that can extend up to thousands of kilometres).
Heating and cooling in the oceans
Solar radiation is the principal source of heat to the and, oceans and atmosphere. This energy is distributed across a wide range of wavelengths (ultra-violet, visible and infra-red). Some of the UV and visible light that enters the earth’s atmosphere is converted to heat and re-radiated as infra-red radiation. At the whole of earth-system scale, it is the balance between solar radiation input and infra-red radiative export that determines whether the earth system is warming or cooling.
Atmospheric CO2 absorbs infra-red radiation more efficiently than it absorbs visible light and ultra-violet light. Thus, increasing concentrations of atmospheric CO2 are reducing the ease with which the sea, land and lower reaches of the atmosphere can radiate excess heat back into space, but making relatively little difference to the rates at which they acquire solar energy. The net result is that the earth and lower atmosphere will warm until a new equilibrium (between incoming and outgoing energy is attained).
Radiative exchanges of energy across the sea surface also play are key role in determining where and when the seas lose heat to the overlying atmosphere and when they gain heat from that overlying air but other processes are also important – notably evaporative cooling. Whilst solar radiation and day-length are comparatively easy to quantify and represent in models, processes such as evaporation and radiant heat loss from the atmosphere to space are much more difficult to reliably represent – because they are influenced (and influence) myriad other weather-related characteristics (wind, wave characteristics, humidity, cloud cover, etc.
Water has a high specific heat capacity: the quantity of energy required to raise the temperature of a gram of water by one degree is large in comparison with the quantities required by many other materials. Conversely, this implies that water must surrender a large quantity of energy to cool meaningfully. Relative to water’s specific heat capacity, the rates of solar energy input are high enough to cause meaningful heating of only a few vertical cm-worth of water over a day.
The fact that warm water (and freshwater) tends to be more buoyant than colder, saltier water further serves to buffer deeper waters against the consequences of heat gain/loss across the sea surface. As the day-length increases during the spring, near-surface waters are the first to warm. As their buoyancy increases, they become less likely to mix into the deeper (less buoyant) waters. Thus, the incoming solar heat becomes increasingly more likely to become trapped near the surface. This means that the water column often develops a two-layered structure during the summer half-year. Consequently, the amplitude of the annual temperature cycle tends to be greater in near-surface waters than in near-bed ones. In coastal regions, river inputs can also promote stratification (even allowing it to persist through the winter).
The net result of water’s large heat storage capacity (relative to rates of energy delivery/loss across the sea surface) is that meaningful large-spatial-scale temperature anomalies require weeks-months to develop. Whilst storms can quickly erode a surface temperature anomaly – they do so at the cost of raising the temperatures deeper in the water column such that those deeper waters are more likely to become (even more) anomalously warm.
The strong mixing that is associated with storm events can temporally disrupt thermal stratification (and, in some coastal regions, tidal stirring can preclude persistent stratification). Since storms are short-term (weather-scale) features, and some characteristics (intensity & duration of rainfall, wind strength etc.) can be strongly influenced by local topography, the present models are less likely to reproduce even month-scale.
Forecasting models
Long-range forecasts become less certain further into the future. NIWA is drawing upon forecast simulations issued by the Copernicus Climate Change Service (C3S, https://climate.copernicus.eu/). Those simulations extend six months into the future, but predictions made in (e.g.) June for (e.g.) July prove to be substantially different to those first made for that July during the preceding January. NIWA will be issuing new forecasts onto this page around the 20th of each month.
The models which we are drawing upon have a relatively coarse resolution of about 110x110km. The models are likely to be more reliable in regions where there are no strong local sources of heat (warm or cold rivers, geothermal inputs etc) and where bathymetry/topography etc. vary only slowly (such that winds, cloud cover, rainfall are more likely to be spatially uniform). This implies that they are more likely to be reliable in open ocean areas than in coastal areas. In particular, they are less likely to be accurate in shallow waters and regions where the coastline or bathymetry have complex shapes or where river inputs play a large role in the local patterns of water movement and heating/cooling. NIWA is seeking data to further establish the reliability of the present forecasts in such regions and we hope to be able to establish and improve the reliability of forecasts for such regions in the future.
NIWA provides these forecasts in the hope that readers will find them interesting. NIWA is keen to work with interested parties to make future forecasts more relevant to their needs. Thus, we welcome any feedback you are prepared to offer:
- What geographic areas are you especially interested in?
- How are you using the forecasts?
- Could they be presented in a manner which would make them more useful to you?
- Do you hold long-term historical sea-surface temperature records for any region that could assist with our ongoing efforts to develop forecasts that have a higher spatial resolution for inshore regions?
This work is funded through NIWA’s Strategic Science Investment Fund from the Ministry for Business, Innovation and Employment.
Forecast Coromandel Town SST anomalies (˚C) over the next 6 months:
| Month | 25th percentile | 50th percentile | 75th percentile |
| Feb | 0.75 | 1 | 1.25 |
| Mar | 0.81 | 1 | 1.17 |
| Apr | 0.9 | 0.98 | 1.02 |
| May | 0.72 | 0.86 | 1.02 |
| Jun | 0.57 | 0.68 | 0.87 |
| Jul | 0.4 | 0.49 | 0.68 |
Forecast Golden Bay SST anomalies (˚C) over the next 6 months:
| Month | 25th percentile | 50th percentile | 75th percentile |
| Feb | 1.07 | 1.25 | 1.42 |
| Mar | 1.16 | 1.49 | 1.57 |
| Apr | 1.15 | 1.52 | 1.53 |
| May | 0.84 | 1.08 | 1.22 |
| Jun | 0.7 | 0.82 | 1 |
| Jul | 0.57 | 0.58 | 0.76 |
Forecast Opotiki SST anomalies (˚C) over the next 6 months:
| Month | 25th percentile | 50th percentile | 75th percentile |
| Feb | 1.01 | 1.08 | 1.14 |
| Mar | 0.71 | 0.78 | 0.85 |
| Apr | 0.62 | 0.63 | 0.64 |
| May | 0.22 | 0.31 | 0.4 |
| Jun | -0.11 | -0.01 | 0.09 |
| Jul | -0.29 | -0.18 | -0.06 |
Forecast Pelorus Sound SST anomalies (˚C) over the next 6 months:
| Month | 25th percentile | 50th percentile | 75th percentile |
| Feb | 1.16 | 1.2 | 1.24 |
| Mar | 0.95 | 1.15 | 1.25 |
| Apr | 0.72 | 0.84 | 1.09 |
| May | 0.68 | 0.91 | 1.04 |
| Jun | 0.66 | 0.92 | 0.93 |
| Jul | 0.57 | 0.74 | 0.75 |
Disclaimer: The forecasts offered in this page draw upon modified Copernicus Climate Change Service Information [2022](C3S, https://climate.Copernicus.eu). There is inherent uncertainty in forecasting sea surface temperature and neither NIWA nor the licensors of the C3S products (being the European Union represented by the European Centre for Medium-Range Weather Forecasts) make any representations or warranties as to the information and figures on this page. Neither NIWA nor the licensor of the Copernicus products accept any liability for any loss or damage incurred by anyone from use or reliance on the information or figures.
This work is funded through NIWA’s Strategic Science Investment Fund from the Ministry for Business, Innovation and Employment.