The atmosphere continued to respond to a warm pool of water in the central and western equatorial Pacific, as evidenced by above normal rainfall and cloud cover across the region. As this warm water propagates eastward with time, the atmospheric response may become more aligned with an east-based El Niño.
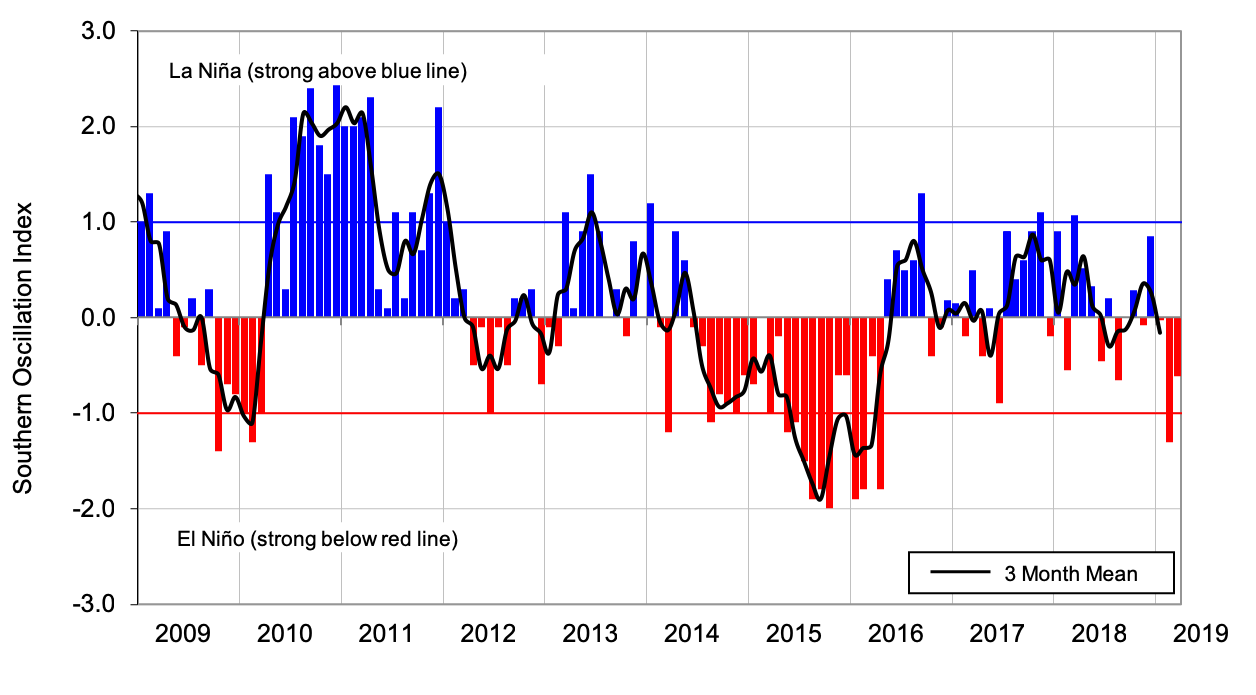
The Southern Oscillation Index (SOI) was negative during March (preliminary value of -0.7), although not as persistently negative as in February. Typically, SOI values below -1.0 for three consecutive months indicate El Niño –the current El Niño event has not reached this conventional threshold. This could be the result of the central-based El Niño event influencing the synoptic pressure patterns near Darwin and Tahiti away from what might be considered conventional. For now, a weakly coupled central-based El Niño remains present.
The probability for oceanic El Niño conditions, according to the consensus from international models, is 90% for the April –June period. For July –September, the probability has increased to 73% from 55% last month. El Niño conditions remain the most likely outcome for the October –December period at 61%. This continues to suggest the potential for a ‘protracted’ event (multi-year duration).
Sea Surface Temperatures
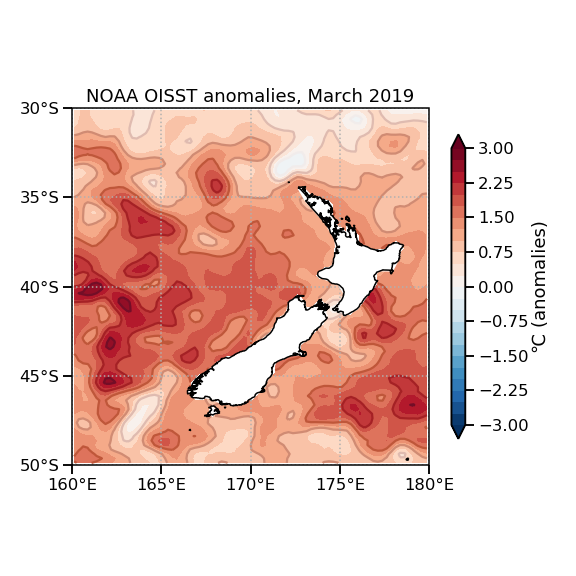
New Zealand’s coastal water temperatures for March 2019 were above or well above average. Anomalies of 1 to 3 ̊C were common in the eastern Tasman Sea and in east-coastal areas of the North Island. Very warm air temperatures during late March pushed anomalies to 2 to 4 ̊C. Marine heatwave conditions continued in the Tasman Sea and in parts of New Zealand’s coastal waters.
Warmer than average sea surface temperatures are forecast to persist during the coming three-month period, very likely influencing above average air temperatures for at least the start of the season. These warm seas may also invigorate low pressure systems as they approach New Zealand from the west.