In 2019, NIWA worked with Year 8 students (aged 12 and 13) at Arrowtown School on a project funded by Unlocking Curious Minds to analyse, visualise and communicate air quality data collected during the winter as part of NIWA's Community Observation Networks for Air (CONA) project.
This project was closely linked to NIWA's 2019 work with the Arrowtown community installing air quality sensors around the town and inside homes. Children at the school worked with data from these sensors to explore the effect of using wood burners for home heating on indoor and outdoor air quality during winter.
Below you can watch some of the resulting videos of students asking and answering questions about air quality in Arrowtown and see how they visualised some of their results.
When do people light their fires in Arrowtown?
Jared - This graph shows the average times that the fires in Arrowtown were lit during the month of June. As you can see, most of the houses would likely have their fire on in the morning, but will let it die out as the day goes on. At 3:00pm the residents seem to relight their fire and keep stacking logs inside, soaring above the base temperature 14o and into the 40o - 50os before leaving the fire to die out at its peak at 8:00pm.
Does being inside protect you from outdoor air pollution?
We are collecting data from both inside and outside peoples' homes in Arrowtown. Eliana from Arrowtown School discovered that PM2.5 levels inside homes are lower than outside but you can still be vulnerable to air pollution due to opening of doors and lighting of fires.
How is temperature affecting PM2.5 levels inside and outside your homes?
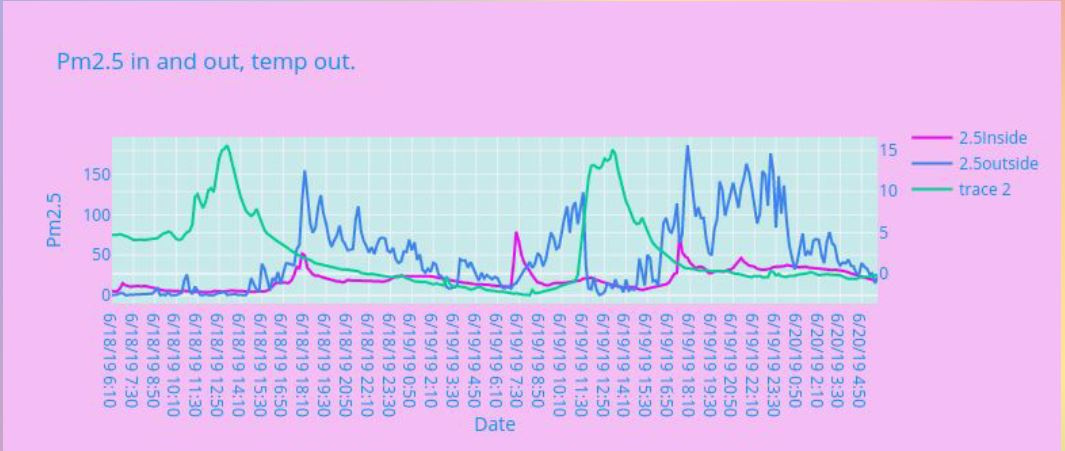
Alice McPike: In this above plot, you can see PM2.5 on the inside of one of the homes in Arrowtown (the pink line), outdoor PM2.5 (the blue line) from the nearest ODIN to this house and and also the outdoor temperature (the green line) from the ODIN. PM2.5 levels raise both in and out when it gets colder. This is because they start to light their fires. PM2.5 levels inside their homes are lower than PM2.5 outside overall, however, there are times when they are higher inside than outside.
How does air quality vary at different times during the day?
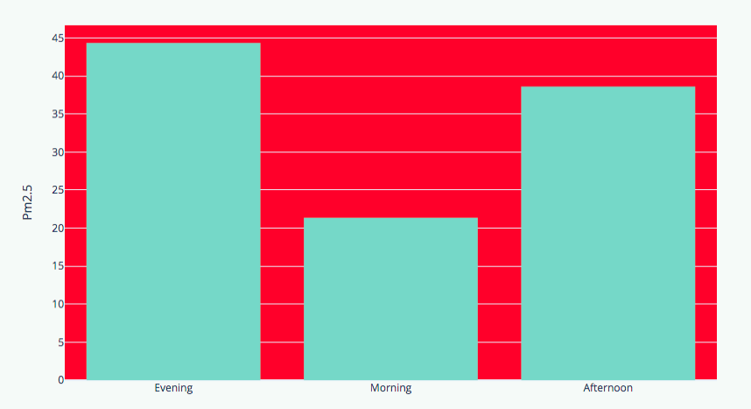
The chart shows morning, afternoon and evening averages of PM2.5 at one of the ODIN sites.
Eva Hemingway - The highest concentrations recorded at this site: 44.32 μg/m3 and the lowest: 21.35 μg/m3. What I find interesting is that there are more particles in the air in evening than in the morning. This is because we light our fires in the evenings.
Spatial Patterns in Arrowtown
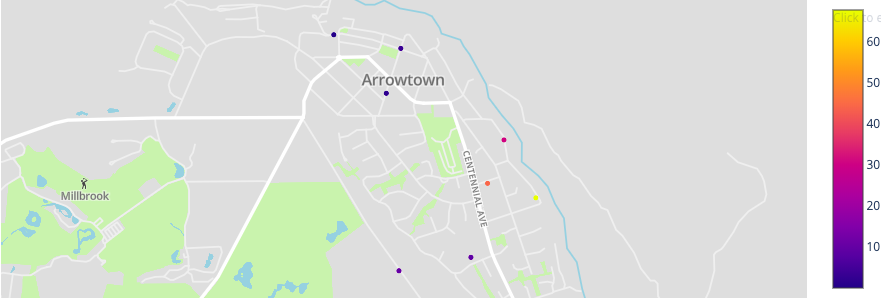
The map shows evening averages for ODIN sites for 2 days in June. Each dot on the map is an ODIN site.
Jared Long -This is the map of the PM2.5 concentrations for the evening on the 3rd - 4th of June. In this diagram, the darker colours present a lesser level of PM2.5 and the light colours present a higher level. It seems from the diagram that the PM2.5 levels are higher when they are closer to the river, which hints that the PM2.5 gets blown down towards the river after covering Arrowtown.