PDF of this article (102 KB)
Every three or four years the World Meteorological Organization (WMO) and the United Nations Environment Programme (UNEP) jointly publish a report on the current understanding of the stratospheric ozone layer and its relation to humankind. The report provides information to the Parties of the United Nations Montreal Protocol (to which New Zealand is a signatory) to guide the development of policies for future protection of the ozone layer.
In this article we provide a concise policy-relevant summary of the issues raised in the Scientific Assessment of Ozone Depletion: 2002 that are particularly pertinent to New Zealand. These are:
- Observed ozone changes: How has ozone been changing and how has this differed between Northern Hemisphere and Southern Hemisphere mid-latitudes (35°–60°)?
- Understanding ozone changes: To what extent can we explain current ozone trends over New Zealand?
- Antarctic ozone: How has the ozone hole changed and when can we expect its recovery?
- Ultraviolet radiation: How has summertime UV been changing over New Zealand?
- Future ozone: How will ozone over New Zealand change in the future and will this be influenced by climate change?
1. Observed ozone changes
The way in which long-term ozone changes are reported in the 2002 assessment is different from that in most previous assessments. Previous assessments reported past ozone changes as the slope of a straight line fitted to measurements from ground and satellite-based instruments. However, ozone changes from 1964 to 2000 (the period covered by the 2002 assessment) were not linear. There were intermittent downward shifts and in some regions ozone increased over short periods. The linear-fit approach therefore oversimplifies the way in which ozone levels have been changing.
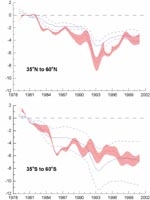
To show more clearly how ozone has changed in the past, and the extent to which models can track these variations, the 2002 assessment reports changes as deviations from a long-term background. Figure 1 shows changes in mid-latitude ozone, as a percentage deviation from the 1980 value, together with model estimates of past changes.
The changes over the past 25 years have been markedly different in the Southern Hemisphere compared to the Northern Hemisphere. With respect to a 1964–1980 baseline, ozone averaged over 1997–2001 was 3% below the baseline in northern mid-latitudes and 6% below the baseline in southern mid-latitudes. The precipitous decrease in southern mid-latitude ozone in the mid-1980s was not matched in the north. The decrease in Northern Hemisphere mid-latitude ozone following the eruption of the Mt Pinatubo volcano in June 1991 is not reproduced in Southern Hemisphere mid-latitudes (see Figure 1).
There are also distinct differences between the north and south in the way in which ozone trends vary with season. Over Northern Hemisphere mid-latitudes, larger ozone decreases are observed during winter/spring (about 4% below 1964–1980 mean), with summer/autumn decreases of around 2%. Over Southern Hemisphere midlatitudes, ozone decreases are of similar magnitude (around 6%) during all seasons. These hemispheric differences in the seasonality of ozone changes drive different responses in surface UV in the north and south. Summertime ozone decreases are more important than wintertime decreases (see Antarctic ozone) in relation to ozone effects on UV radiation.
2. Understanding ozone changes
While linear trends calculated from models agree well with observed trends (i.e., using the approach of the 1998 assessment), the models are far less able to track inter-annual variability over Southern Hemisphere mid-latitudes compared to northern mid-latitudes (Figure 1). The two features in southern mid-latitude ozone change highlighted in Section 1 remain unexplained: the sudden decrease in ozone in the mid-1980s (which is not tracked by the models) and the absence of a response to the Mt. Pinatubo eruption (which the models indicate should be present). These model shortcomings reveal gaps in our understanding of the key processes affecting Southern Hemisphere mid-latitude ozone. Until our understanding has been improved, model predictions of future ozone will not be reliable.
3. Antarctic ozone
Springtime Antarctic ozone depletion has remained very large during the 1990s and as yet shows no sign of recovery. Meteorological analyses show that over the last decade the Antarctic polar vortex has persisted longer than in the 1980s, and now breaks up one month later, in late November or early December. This prolongs the period during which Antarctic ozone depletion occurs with two important consequences:
- It triggers higher peak UV levels over the Antarctic. The highest UV dose under the ozone hole is not typically observed in September–October, when maximum ozone depletion occurs, but in November–December when solar elevations are higher while ozone is still low.
- The later the vortex breaks up, the closer it is to the summer solstice when ozone-depleted air is mixed out over New Zealand. The combination of suppressed ozone and high solar elevations drives an increasing trend in summertime UV over New Zealand (see Ultraviolet radiation).
Note that the ozone hole itself has never come close to New Zealand.
Emissions of most ozone-depleting gases have almost ceased following implementation of the Montreal Protocol. Stratospheric chlorine peaked towards the end of last century and has now begun to decline. The ozone hole is expected to recover as chlorine levels decrease (see Future ozone). However, natural variability complicates the detection of recovery, and increasing greenhouse-gas concentrations could delay the recovery. It may be at least 10 years after stratospheric chlorine peaks before unambiguous recovery is verified.
4. Ultraviolet radiation
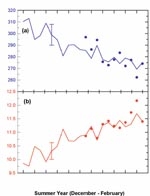
Measurements of summertime UV levels over New Zealand have confirmed that UV has increased in line with expectations following ozone decreases (Figure 2). It should also be noted that summertime UV levels over New Zealand are approximately 40% higher than equivalent northern latitudes in Europe, as a result of less polluted air and lower ozone over New Zealand and because the Sun is slightly closer to the Earth in December than in June. UV levels over New Zealand have always been high and will remain high after the ozone layer has recovered. There is also clear evidence that long-term UV changes over New Zealand are not driven by ozone alone. Other factors such as changes in cloudiness, aerosols and land cover all contribute. The relative importance of each of these factors depends on local conditions. The large uncertainties in future changes of these factors currently prevent reliable predictions of UV over New Zealand.
5. Future ozone
Although future decreases in stratospheric chlorine are expected to lead to a recovery in global ozone, the rate of recovery is likely to be influenced by changes in atmospheric composition caused by increasing emissions of greenhouse gases. While increases in CO2 will warm the troposphere, they will cool the stratosphere.
Stratospheric cooling will have two effects:
- In the upper stratosphere the cooling is predicted to enhance future ozone over tropical and mid-latitudes due to a slow down in the chemical reactions that cause ozone loss.
- A cooling in the lower stratosphere, however, may extend the period over which polar stratospheric clouds are present and will increase springtime ozone depletion.
As a result, although total column ozone is expected to eventually recover to pre-ozone-hole levels, the distribution of ozone in the atmosphere in the future is likely to be different. Ozone will increase in the troposphere due to atmospheric pollution and remain depressed in the lower stratosphere while chlorine and bromine levels remain elevated. This will affect its attributes as a greenhouse gas and as an absorber of UV radiation.
Increases in methane (CH4) and nitrous oxide (N2O) emissions (primarily from agricultural activities) will cause chemical changes to the stratosphere, such as increasing water vapour and NOx levels (see “The importance of water vapour”). These changes in stratospheric composition will also influence ozone depletion processes.
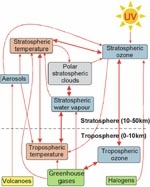
Clearly the coupling between ozone change and climate change is complex (Figure 3). Coupled chemistry–climate models have been developed to capture this complexity by including all known feedbacks between climate change and changes in atmospheric chemistry. One such model (UMETRAC) is run on the NIWA supercomputer. These models have been used to forecast how global ozone levels over the coming decades are expected to change with decreasing chlorine levels and increasing emissions of greenhouse gases (Figure 4). Coupled chemistry–climate models rely on long-term, high-precision measurements for their validation, and the ~22-year time series of NO2 measurements at NIWA’s atmospheric station at Lauder has been used for such validation.
6. Conclusion
The Montreal Protocol appears to be working well and eventually ozone recovery is expected if all parties continue to adhere to the protocol. Approaches to accelerate the recovery of the ozone layer are now limited; the most effective action has already been taken. However, failure to continue complying with the Montreal Protocol would delay or could even prevent recovery of ozone. Verification that the protocol is working, through continuing global observations, is vital.
For more information contact: Greg Bodeker NIWA Private Bag 50061 Omakau Central Otago Phone +64 3 447 3411 Fax +64-7 856 0151 g.bodeker@niwa.co.nz
The Scientific Assessment of Ozone Depletion: 2002 is available in full at www.unep.org/ozone/pdf/scientific-assessment2002.pdf.
The importance of water vapour
Not only is water vapour the most important greenhouse gas, it also plays an important role in stratospheric ozone chemistry. Increases in water vapour promote the formation of polar stratospheric clouds, which are key prerequisites for ozone depletion. Water vapour is not included in the basket of greenhouse gases covered by the Kyoto Protocol since it does not have a large direct anthropogenic source. Stratospheric water vapour measurements at Boulder, Colorado, for the period 1981–2000 show a statistically significant increase of approximately 10% per decade over altitudesof 15–28 km. Approximately half this increase results from increases in tropospheric methane (CH4) which oxidizes to water vapour in the stratosphere. The other half of the increase is currently unexplained. These changes have contributed to ozone decreases in the lower stratosphere.
Ozone and radiative balance in the Earth’s atmosphere
As well as absorbing UV radiation, ozone is also a greenhouse gas. The decrease in stratospheric ozone in the recent past has partially offset the surface warming caused by the increase in other greenhouse gases such as carbon dioxide. This is one example of how ozone depletion and climate change are interconnected (see Figure 3).
Glossary of terms
Aerosols: Small liquid droplets or solid particles suspended in the atmosphere.
Model: A computer program that can simulate ozone changes given the changes in the factors affecting ozone.
Stratosphere / stratospheric: Region of the atmosphere above the troposphere; approximately 11–50 km in altitude.
Total column ozone: The total amount of ozone in a column of air reaching from the Earth’s surface to Space, measured in Dobson Units (1 DU = 2.673 x 10¹⁶ molecules/cm2).
Troposphere / tropospheric: The lowest part of the atmosphere where temperature decreases with altitude; 0–11 km over New Zealand.
