
The Japan Meteorological Agency [ www.kishou.go.jp/english ] operates the Geostationary Meteorological Satellite (GMS), a component of the World Weather Watch meteorological satellite network. (Full-size image, 40K)
The GMS-5 Satellite
GMS is in geostationary orbit 36000 km above the Earth’s surface, meaning that its orbital period is the same as the time it takes for the Earth to rotate once on its axis. This means the satellite appears to be stationary with respect to some place on Earth – for GMS this is over the equator at 140°E, north of Australia. GMS satellites have provided continuous coverage of our hemisphere since 1977, when Japan launched the first satellite in this series.
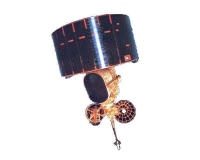
The current spacecraft, launched in 1995, is GMS-5. This spin-stabilised satellite senses both visible radiation reflected from the Earth (and clouds), and infrared radiation emitted by the Earth, clouds, and atmosphere. To do this, it observes the Earth over 4 spectral intervals, called channels.
Nominally, the satellite observes our hemisphere ever hour (except around synoptic hours, when it makes observations every 30 minutes) by scanning from north to south in a series of “lines” over a period of 22 minutes. Each observation contains around 10,000 lines of visible, and 2,500 lines of infrared data.
Due to the age of the current satellite, and the need to extend the life of the spacecraft, this observation schedule has recently been reduced to around 16 observations (for our region) per day.
Description of GMS Channels
| Channel | Spectral Interval | Ground Resolution (km) | Description |
|---|---|---|---|
| 1 | 0.5–0.75 µm | 1.25 | Visible channel: provides high resolution visible imagery |
| 2 | 10.5–11.5 µm | 5 | Infrared channel: indicates the temperature of clouds and the surface |
| 3 | 11.5–12.5 µm | 5 | Similar to channel 2 |
| 4 | 6.5–7.5 µm | 5 | Water Vapour channel: observes emissions from water vapour in the atmosphere |
Example GMS Data
Channel 1
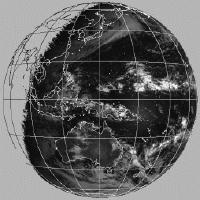
This channel measures visible light (sunlight) scattered or reflected towards the satellite from the Earth and clouds. Clouds almost always reflect more sunlight than land and ocean surfaces, so clouds appear bright in these images. Accordingly, visible images can even be used to identify low lying clouds which are usually “invisible” at infrared wavelengths. Of course visible data are only available during daylight hours.
The example is a visible-light image from GMS near local noon, New Zealand time. Clouds appear bright, and clear areas dark.
Channel 2
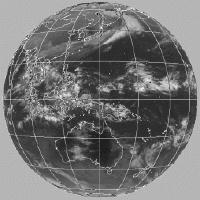
Because the temperature of the atmosphere decreases with height (up to about 15 km), high clouds are colder than low clouds. Hence, the “temperature” of the cloud indicates its height above the surface.
The example shows a Channel 2 infrared image for the same time as the visible image above. Here warm surfaces are shown as dark colours. Clouds are shown in lighter shades, with the whitest clouds being the highest.
Channel 4
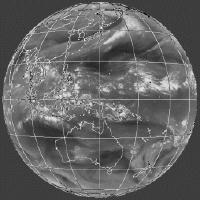
Channel 4 measures emission from water vapour in the atmosphere. Interpretation of water vapour images is complicated due to the variable distribution of the emitting gas (water vapour). However, if the atmosphere is moist then the temperature of the infrared radiation received at the satellite is a measure of the temperature in the upper troposphere, but if the atmosphere is dry, then the temperature measured at the satellite is more likely to represent that of the lower troposphere. If the water vapour has condensed to form a cloud, then the interpretation is similar to that for channel 2 and 3 data.
The example shows a Channel 4 water vapour (infrared) image for the same time as the visible and thermal infrared images above. Dry regions of the atmosphere are indicated by darker shades.