Flooding during early in winter 2015 broke records. Why did they occur? Should we expect more? Can we predict future floods?
On Saturday 20 June, one month’s worth of rain fell across the Whanganui region in 24 hours. At Whanganui Airport, the 79mm recorded on Saturday was the highest in June since 1937.
Waterways throughout the region burst their banks that devastating night. The Whanganui River reached its highest ever, 9.1 metres at Town Bridge at 3am, with a flow rate of 4,690 cubic metres a second. Water spilled into the central business district. The city was cut in half by the closure of bridges for fear they would collapse under the river pressure. By the end of the weekend, all roads in and out of Whanganui were closed.
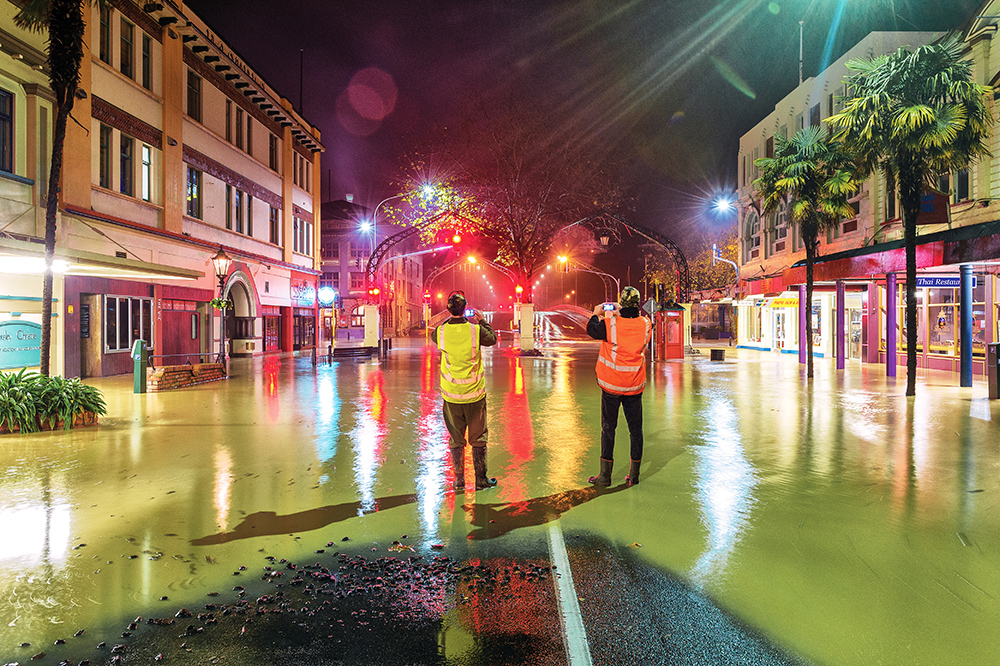
Civil Defence declared a state of emergency. Hundreds of people were evacuated from homes in dozens of places too near flooded waterways.
Whanganui was just one of an extraordinary set of floods in 2015. Kapiti, Horowhenua and Wairarapa were also affected by flooding on 20 June. In April, localised downpours in Wellington flooded commercial premises and roads, and heavy rain in May delivered an entire month’s rainfall in one day. The May event, which centred on the Kapiti Coast, blocked roads and rail across the region with water and debris, flooded Kapiti homes, and one person died in the Hutt Valley. Heavy rain in Dunedin caused surface flooding through the urban areas, which disrupted transport and electricity, and led to slips and damage to homes and road surfaces.
In the exhausted and frustrated aftermath, one question arose: why? The phrase ‘climate change’ was quick to the lips of some commentators. Wanganui Chronicle editor Mark Dawson wrote after the flood, “Climate change and conservation advocates may feel we have brought some of this on ourselves.” Whanganui resident RK Rose commented: “This is what climate change looks like.”
The primary reason for the floods was more prosaic. Dr Sam Dean, NIWA’s Chief Scientist for climate, atmosphere and hazards, says the floods were principally due to the variability of New Zealand weather. He says that in Whanganui there was simply too much rain on already saturated land. Waterways overtopped their banks, drainage was unable to cope with the volume, and buildings were inundated with water. He says, “Developing the tools that will accurately forecast floods with sufficient lead time for people to act is a major focus for NIWA’s research.”
Nevertheless, Sam says the role of climate change cannot be ignored.
“There is indeed growing evidence that rainfall extremes, and the frequency and risk of those, are already worsening in New Zealand as a result of climate change.”
Wetter days are coming
Dr Andrew Tait, a NIWA scientist and Director of the New Zealand Climate Change Centre, says we should brace ourselves for more high rainfall events in the future.
“Climate change is expected to bring warmer, wetter weather to many parts of New Zealand. Flood-causing conditions are likely to arise more regularly.
“Floods caused by rain deluges in the west and south of New Zealand, where annual average rainfall and river flows are projected to increase, are particularly likely,” he says.
Andrew was one of the lead authors for the Australasian chapter of last year’s IPPC Working Group 2 report, which concluded that floods will more frequently impact many of New Zealand’s low-lying areas, as heavy rainfall events are projected to increase in intensity.
He agrees that climate change is very likely already contributing to heavy rain events, but cautions that it’s hard to say by how much.
“Every flood that occurs these days, everywhere in the world, is influenced to some degree by the gradual warming of our atmosphere that has been going on now for several decades.
“A warmer atmosphere can hold more moisture; thus heavy rain-bearing flood-producing storms are all somewhat more intense now than if there was no warming. The difficulty is knowing how much more.”
Andrew says it is very difficult to isolate the influence of climate change by analysing past and present rainfall data.
“It may not be possible to show statistical significance of an increase in heavy rainfall intensity and frequency for several decades to come for New Zealand, due to the inherent variability in our weather and the rarity of extreme events.”
Scientists at NIWA are using climate models to answer this question earlier. These are equivalent to the computer models used to do weather forecasts. They can produce weather systems just like those observed with instruments and satellites.
Sam Dean says, “When models do such a good job of recreating reality, we can then run them lots of times to reproduce the flooding event we are interested in. This gives us the statistical significance we need to make robust statements about how much more intense a flood is now compared to what it would have been if people hadn’t modified the climate.”
Predicting floods
A model that is essential to understanding floods, and forecasting them, is one that simulates the passage of water from rain to waterway.
Dr Hilary McMillan, a NIWA hydrologist, says modelling shows that a complex interaction of factors is required to generate a flood.
“A lot of different processes control when and where rivers flood. It’s too simple to think of floods as simply heavy rain running into rivers, which then overrun their banks.
“The path of rain to waterways is a very complicated one. There are a huge number of factors influencing whether the rain that falls is enough to cause a flood.
“Think of it as a ladder of leaky buckets, each tipping into the one below. Rivers and streams are last in the chain. Whether they flood depends on what is happening in each of the buckets above.
“An example of one bucket is the vegetation canopy in a forest, which transfers water into a bucket below, the soil on the forest floor.
“To forecast a flood you need to know how much rain is falling, whether it lands in the buckets, how much water they already hold, how fast they leak, and when each will tip its load into the next bucket,” she says.
Hilary is part of a team working on two projects to provide accurate river flow forecasts for New Zealand.
The team is refining and applying a water flow model called TopNet. The system models the fall, storage and transfer of rain across a catchment. In addition to an upgraded weather model resolution representing New Zealand in 1.5 square kilometre blocks, TopNet is also being fine-tuned to specific catchments.
Hilary says the model accounts for all the major factors affecting how much water moves into waterways, and its rate.
“Rain transfers through five storage stages: tree or vegetation canopies, in snow, in soil, in the water table and in small streams. At any point it can evaporate back to the atmosphere, pool, or run to the next stage. (See graphic.)
“The conditions in each of the storage and transfer points are critical to movement of the water to the next zone. Conditions can vary greatly across any catchment – the area where water is draining into common end points.
“Flash floods can arise from extremely wet soil conditions, fast snow melts combined with heavy rain, and many other combinations of factors.”
Soil saturation is a key flood condition. If the water table is close to the surface, there is no room to hold rain that lands or runs onto it. Water will continue to run across the surface until it finds a waterway, or is forced to pool into bodies of water.
Hilary cites an almost endless series of factors that need to be considered in a model, such as dust in extremely dry areas coats raindrops, preventing them from soaking into the soil; heavily forested areas suspend more water on leaves and in roots; mountains and hills suspend rain in snow; and snow melt increases the flow of water to rivers.
The complexity explains why forecasting a flood is so difficult.
Yet that is exactly what Hilary’s team is attempting to do for the West Coast Regional Council. The Envirolink-funded project, currently close to going live, will use TopNet to forecast flow and volume in the Buller and Grey Rivers. Armed with river flows forecast from 1 to 36 hours ahead of the rain actually making it into the rivers, the council will be able to judge the likelihood of floods and make plans.
Data will be used to set up the tailored West Coast model from various sources, such as rain gauges, soil conditions from Landcare Research, land cover, geology and river network data, and river flow data.
The model will make forecasts on river flow based on actual data, but also on predicted rainfall and humidity data.
NIWA’s weather model that provides the rainfall forecasts has been recently upgraded so it represents rainfall data in 1.5km² blocks, rather than the previous 12km². This degree of resolution allows storm systems and interactions of weather fronts and mountains to be more accurately modelled, increasing the accuracy of the total volume of rain forecast to fall in each catchment.
“Weather forecasts have vastly improved, enabling us to forecast river flows many hours ahead of time. The degree of system latency is critical to the success of these forecasts. The council needs time to move people and assets ahead of a flood,” Hilary says.
The project will progressively tweak the model to better represent what happens in the catchments feeding the Buller and Grey Rivers.
The past five years of weather data will be directed into the model, to identify areas where predicted river flows differ from actual river flows measured on the ground.
“We’ll pick out the top parameters that control the model flow predictions, and fine-tune their values in the West Coast model.”
NIWA’s flow prediction model uses a unique method that feeds real-time measured river flow observations back into the model. This corrects the model on-the-fly to improve future forecasts, and ensures that errors in rainfall forecasts don’t accumulate in the model.
A feasibility study is in the wings to run a flood forecast model for the whole country. Hilary says, “This exciting project will use data on things like soils and vegetation mapped for the whole of New Zealand and will rely on NIWA’s supercomputer for the huge computer power needed. The team is also thinking carefully about how to visualise the large amount of flow forecasts produced.
“The link between the higher resolution weather model and the TopNet flow prediction model has only just been completed, but it should provide a far more accurate and timely warning of river flows than was possible before.”
TopNet is simultaneously being tuned by another NIWA project to forecast river flows and floods, decades and even millennia into the future. A team working on regional climate models (RCMs) estimating future climates is modifying them to provide data for hydrological models that generate future water flow predictions across New Zealand.
NIWA’s Dr Christian Zammit says preliminary results indicate that flood event characteristics are expected to change significantly in terms of duration and maximum intensity. Water & Atmosphere will report further on this project in a future issue.

Measuring up
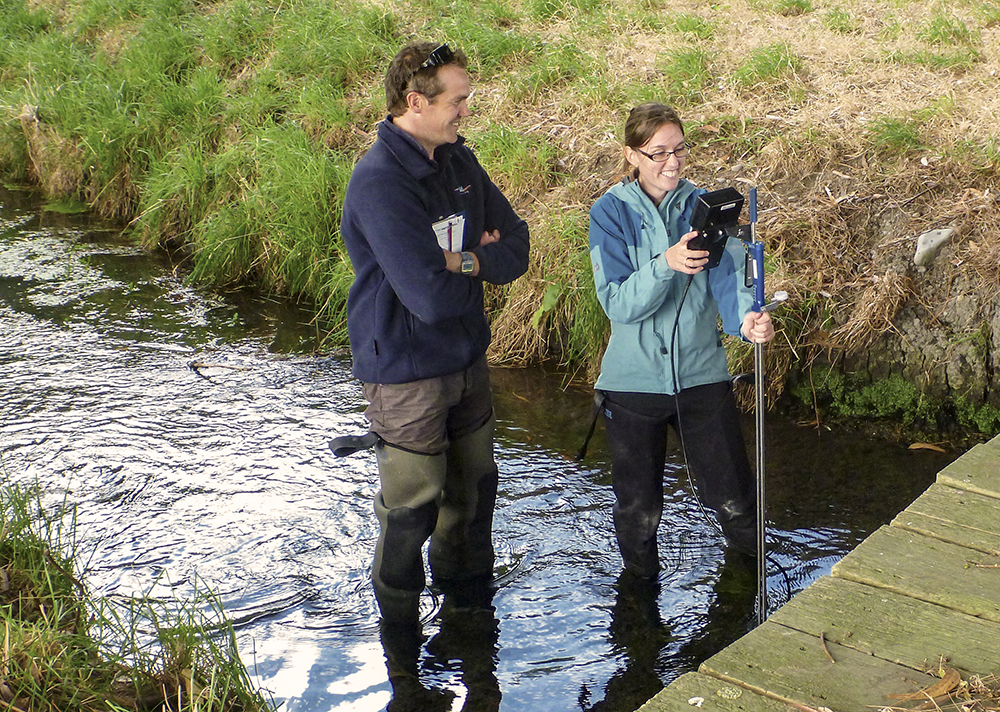
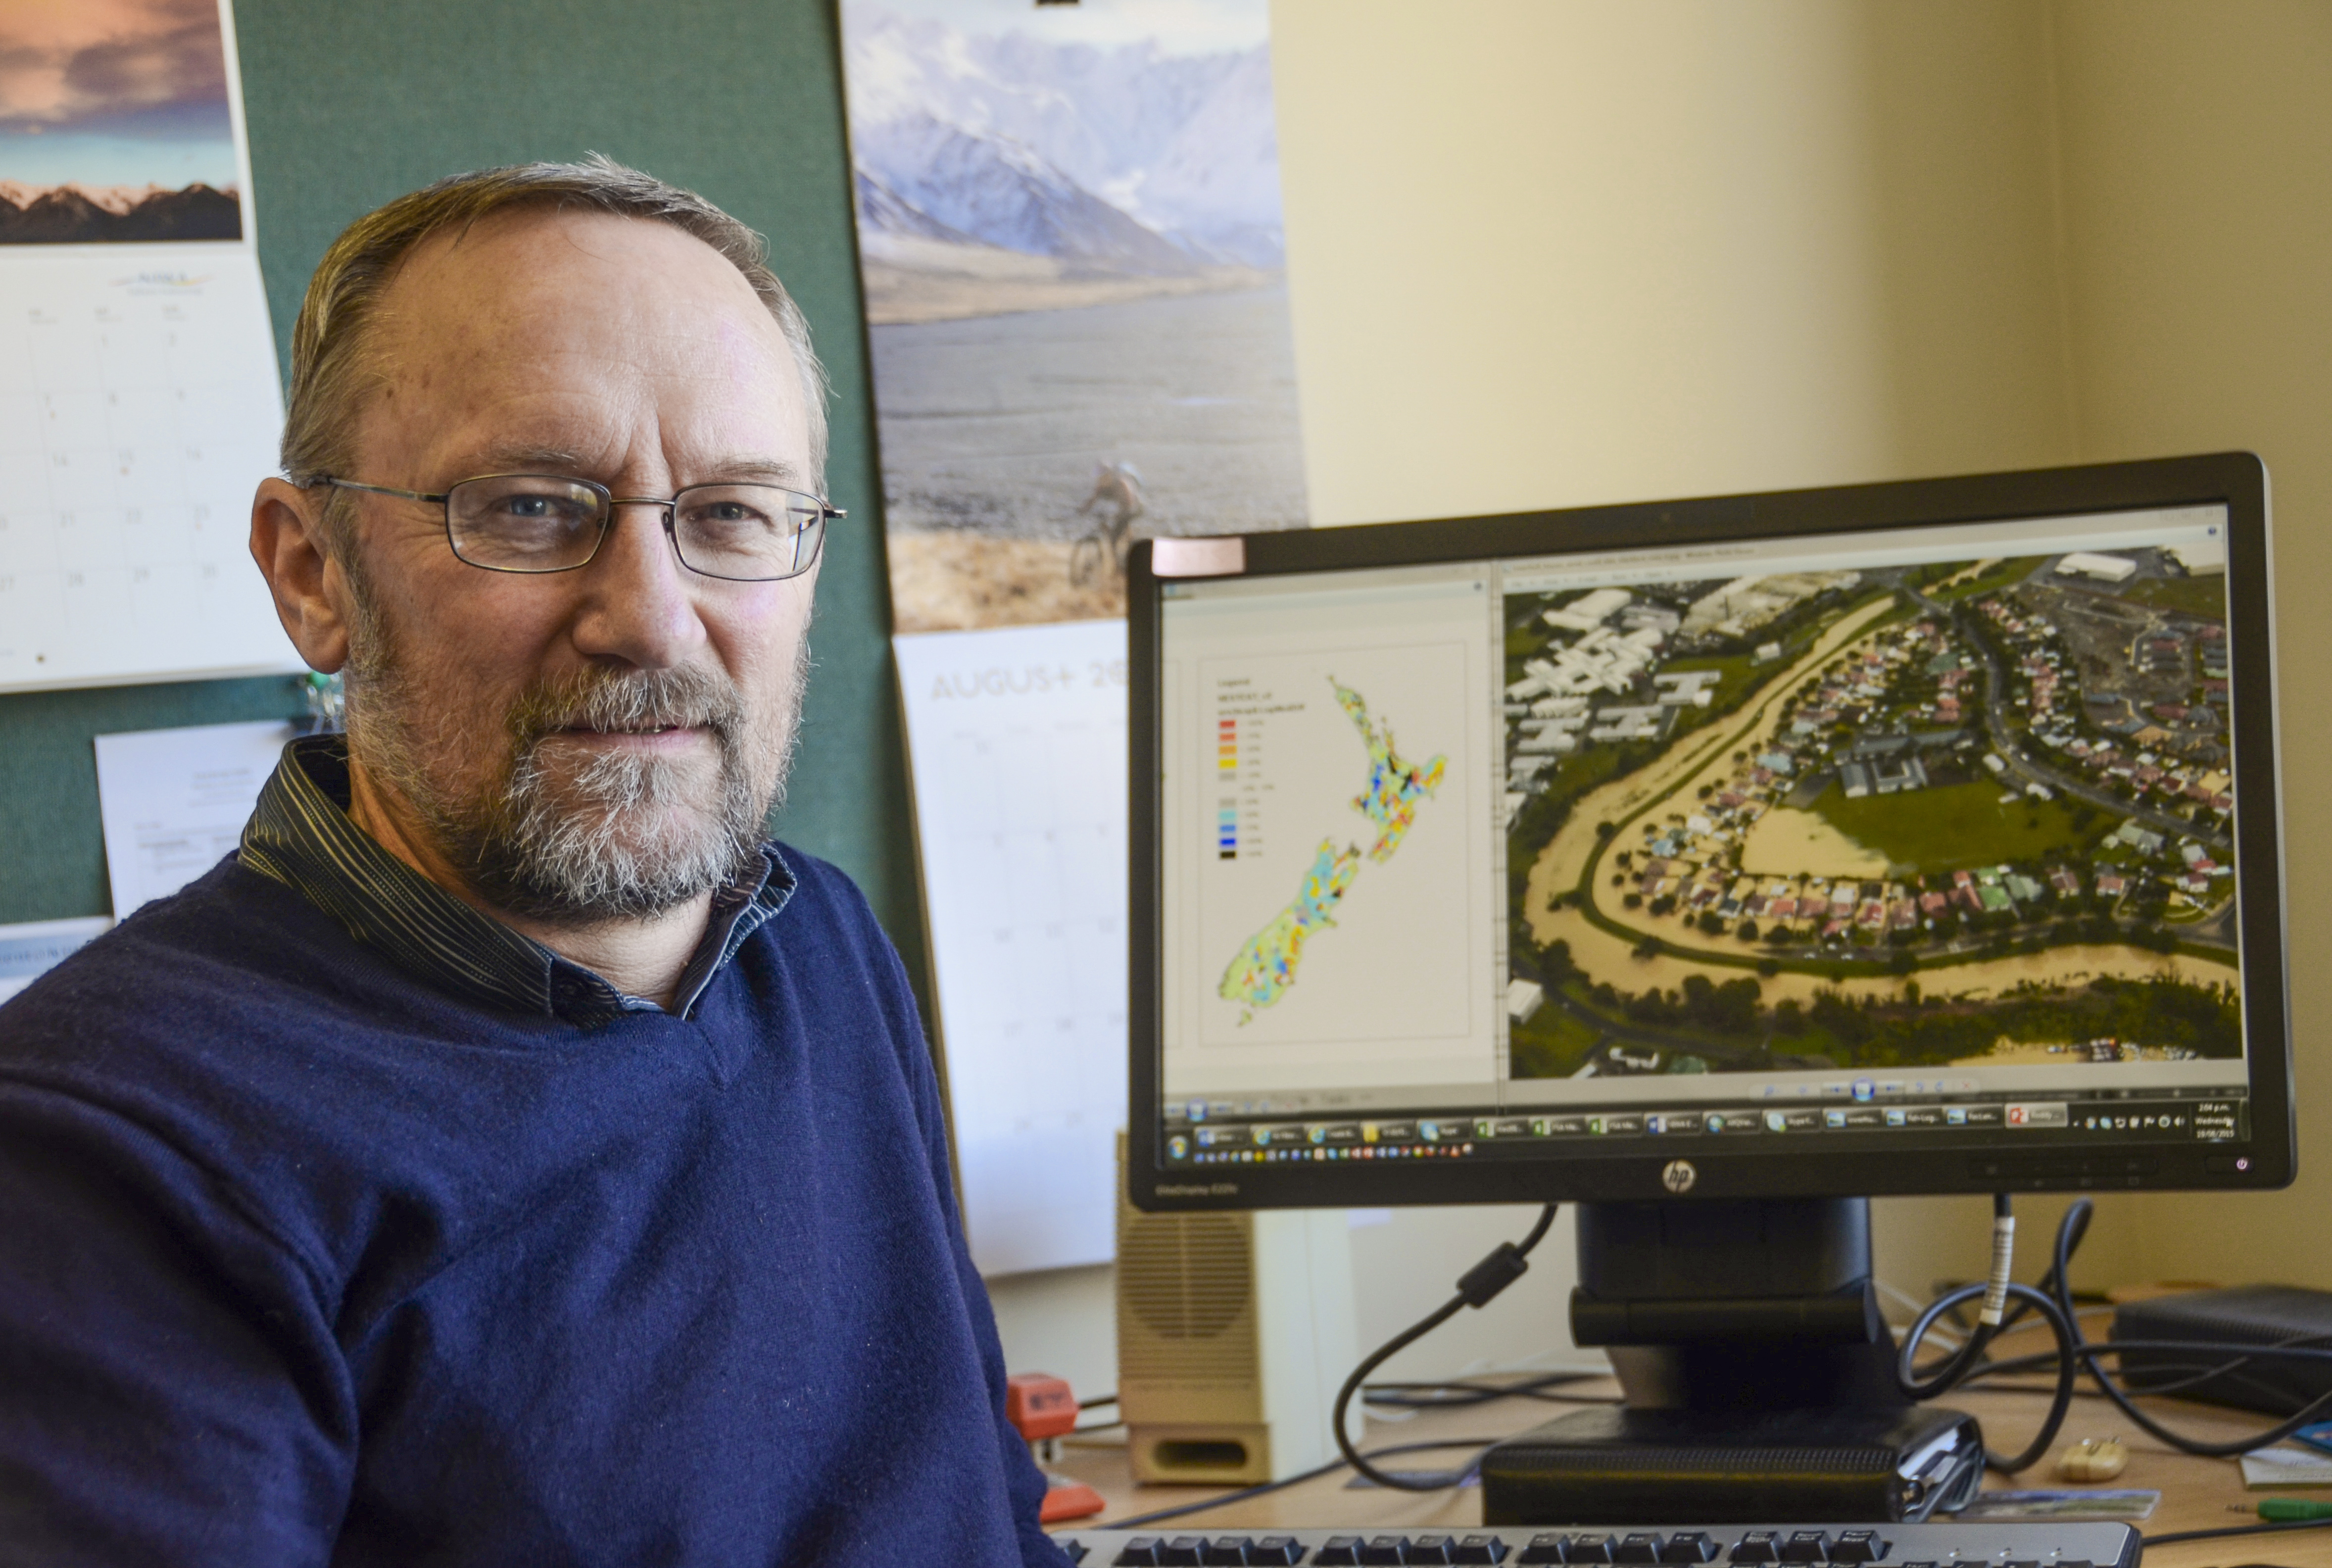
To understand the magnitude of current and future floods, accurate data are essential. So when Whanganui and Dunedin flooded, NIWA’s Ryan Paulik and Dr Kate Crowley went to survey the damage.
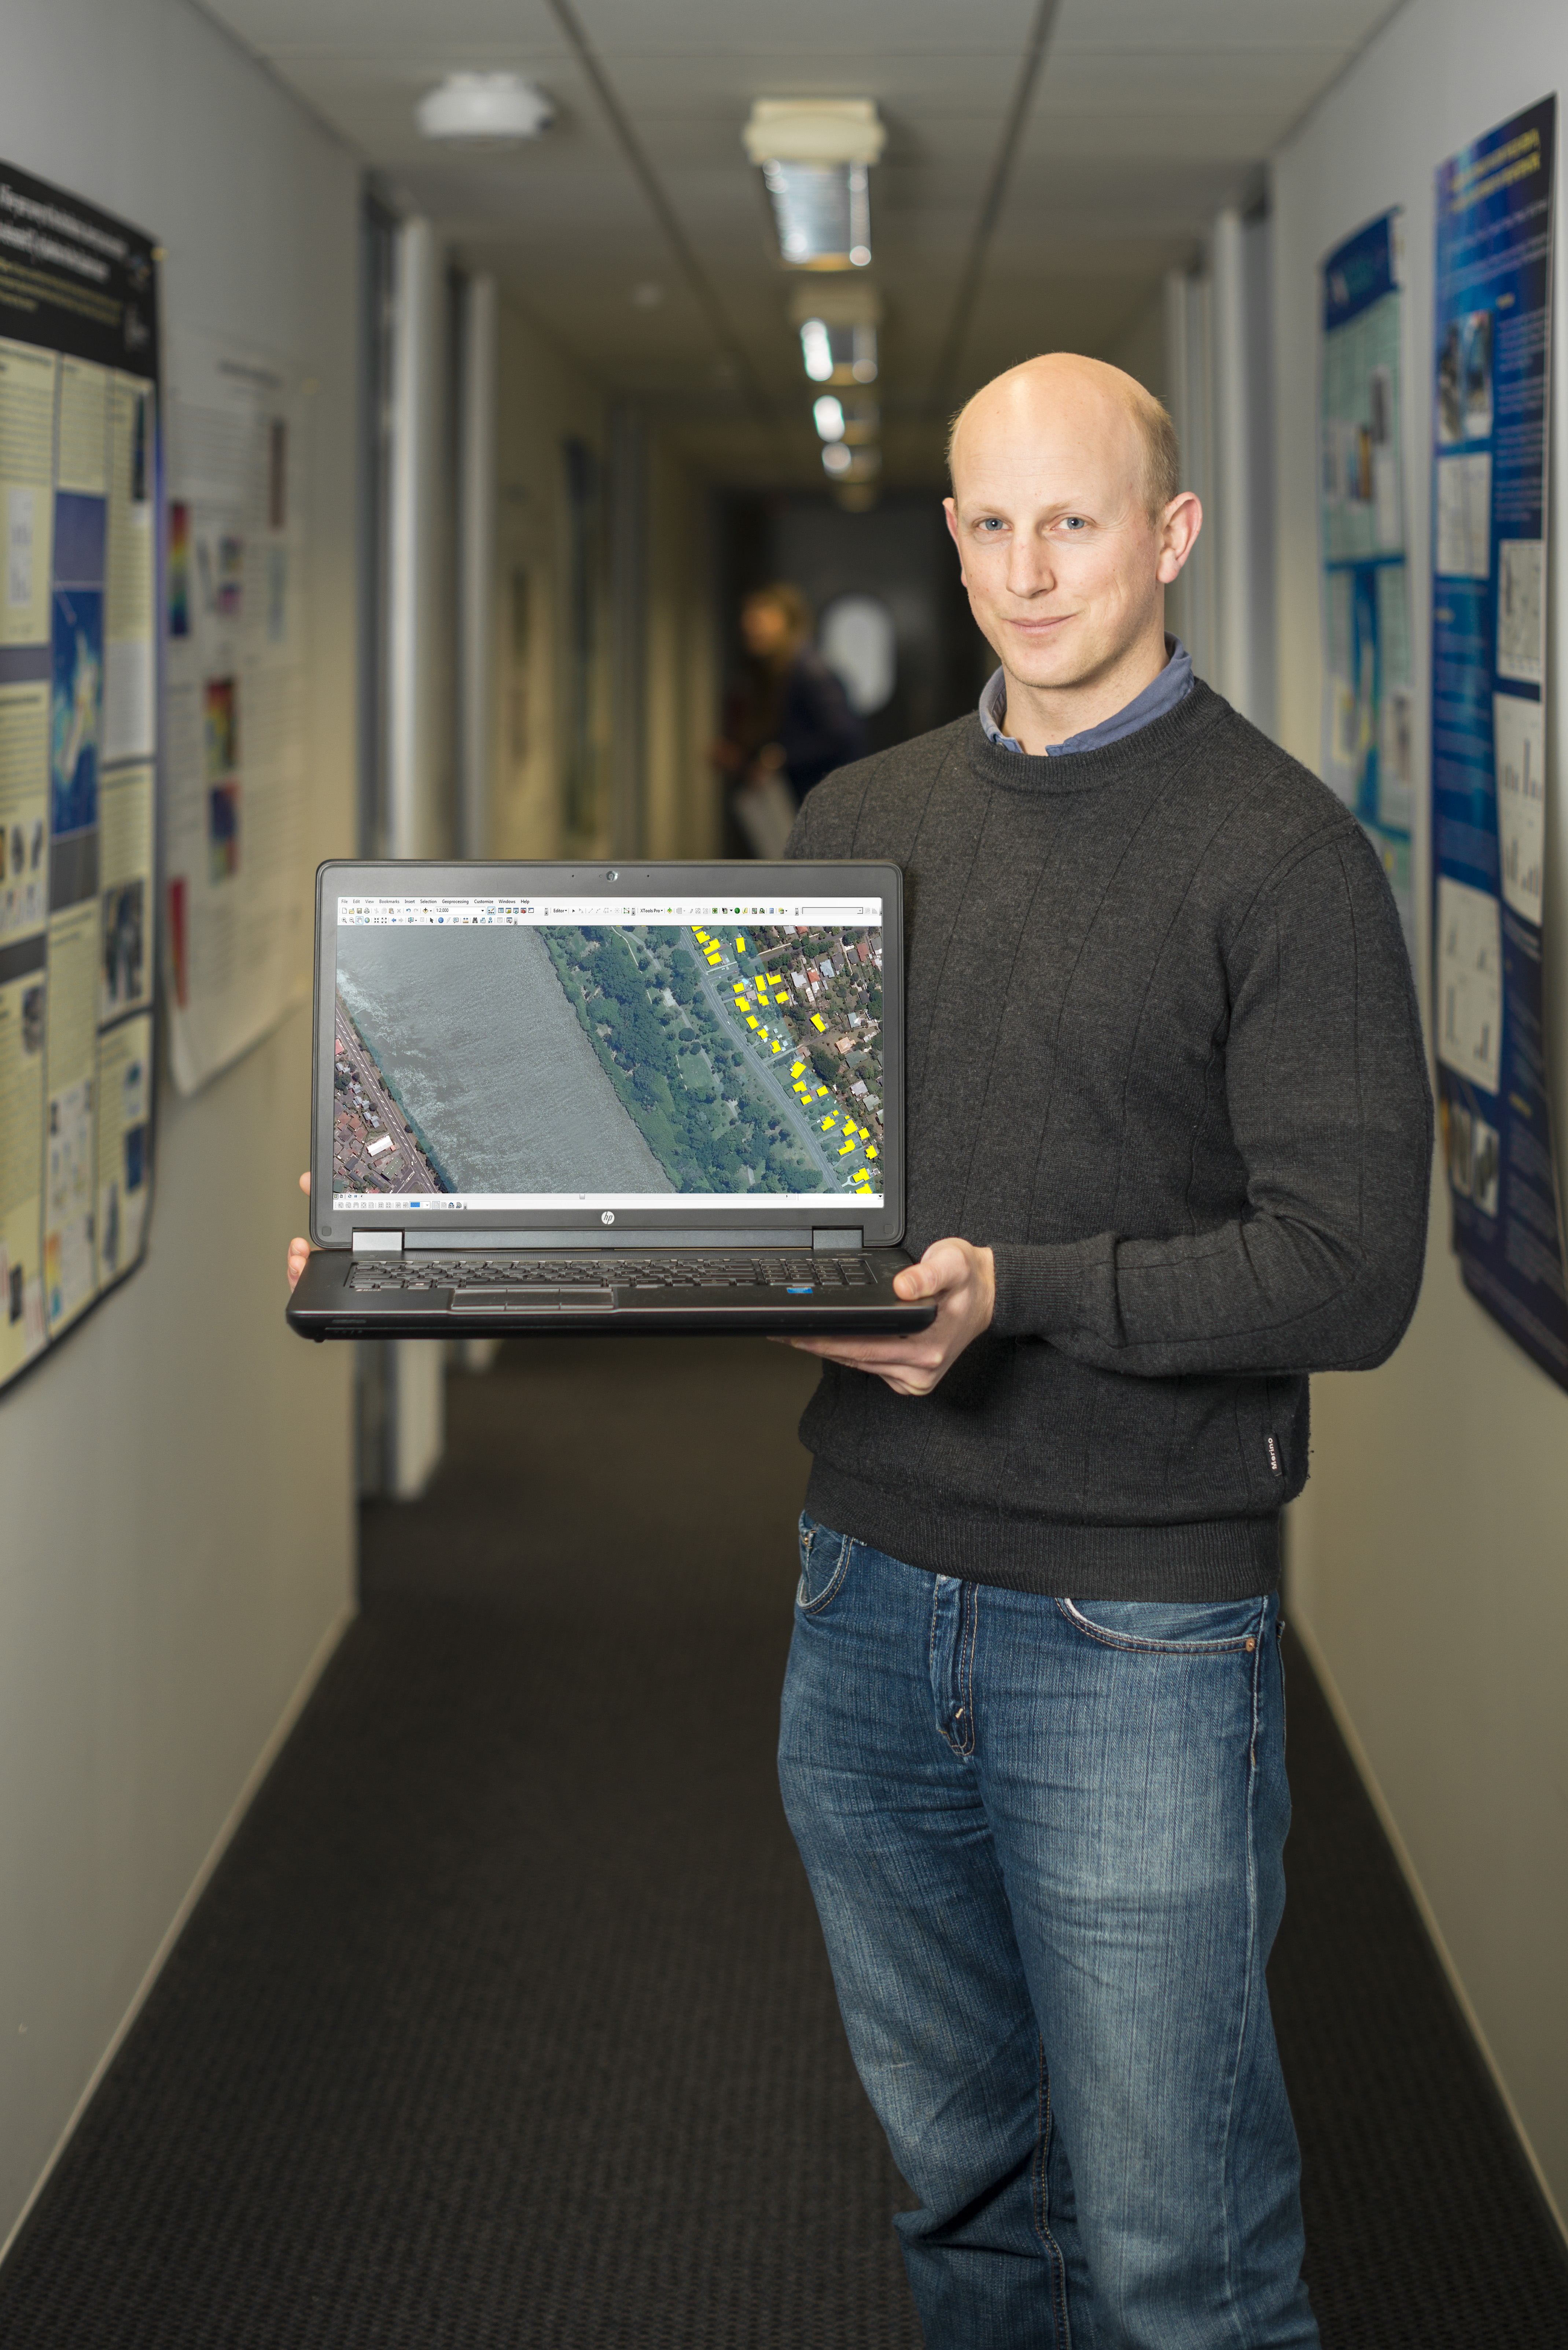
The team covers an average of six floods each year, recording flood depths against property and the cost of damage to buildings and economic effects from impacts on businesses. Their data feed into NIWA’s RiskScape software, which is used to estimate impacts and losses (economic and social) for assets exposed to natural hazards.
RiskScape models are built on actual observed and quantified damage from previous hazard events like floods to human structures like buildings, cables and pipes, roads and waterways.
This year the pair surveyed over 80 buildings in Whanganui and 200 in Dunedin, noting the building types, the water depth and the type of damage, and they are estimating the cost of repair.
The NIWA data on Whanganui are not yet complete, and Ryan is reluctant to declare the Whanganui flood a ‘record’ for the city based on data they collected.
“The true costs of the flood event will not be known for some time. Although the data we collected are useful for estimating direct costs for buildings and contents damage immediately following the flood, economic losses associated with clean-up, temporary accommodation and business disruption will accrue for many months to come.
“It was the worst damage to residential buildings I have seen since joining NIWA. The high water depths in buildings and silt deposition made it extremely messy to clean up.”
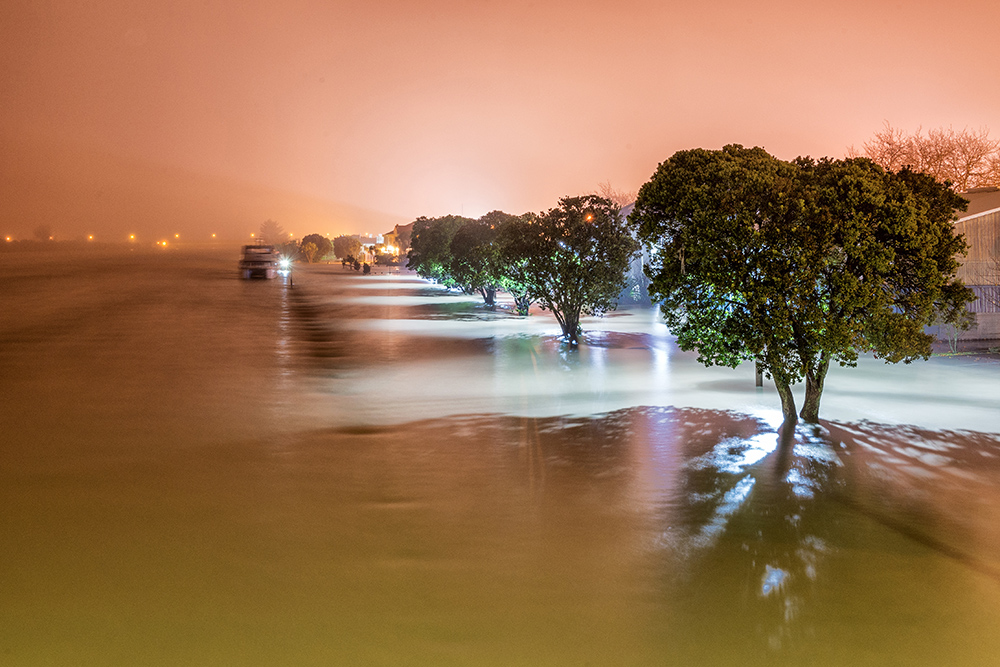
The worst hit locations were low lying and near rivers.
“In Whanganui and Whangaehu, buildings were flooded by adjacent rivers breaching their banks, while in Waitotara flooding was mostly caused from a smaller stream running through the town.
“Pastoral farm land both upstream and downstream of Waitotara and Whangaehu were severely damaged from flooding and silt deposition.”
Damage valuation is not an exact science, but the team is well practised. The valuations are based on estimates of what insurance companies will pay out for losses. So the NIWA team has calibrated past valuations against the initial and final assessments by insurance companies. To help understand the engineering impacts of water, they have included BRANZ (Building Research Association of New Zealand) experts on some of their field trips.
“We attend a range of different floods, to increase the relevancy of the data, but we’re looking at flood events where the damage is in the millions of dollars.
“There’s clearly a difference in costs when you have to replace a floor rather than clean it, but the judgement on when to replace is variable. Our data have to take into account a range of decisions made by insurance companies,” he says.
RiskScape can be used for any resource or emergency management activity that requires information on natural hazard impacts or losses. The models estimate the damage inflicted by future floods with similar conditions.
Ryan’s and Kate’s property damage data from Whanganui and Dunedin will be added to a library of flood impact information. Each new data set is used to validate RiskScape’s flood vulnerability models for buildings.
RiskScape users can apply these models to estimate building impact and loss for future flood events. This can support community decisions on selecting the most suitable options to avoid or mitigate flood damage, such as raising floor levels, removing buildings from the floodplain or upgrading stop banks.
Higher frequencies
A consistent complaint in public commentary this year was that floods described as ‘one in one hundred year’ events seem to be happening on a regular basis.
NIWA is currently recalculating the data and calculations behind these widely used estimates of how often New Zealand waterways flood. They were last published in 1989.
The estimates are essential because New Zealanders need to know how often rivers flood, to assess the value of adapting to them, and to set thresholds for the robustness and design factors of buildings and infrastructure.
Roddy Henderson of NIWA’s Natural Hazards Centre says it is essential to update the estimates because New Zealand only has relatively short periods of data on record.
“We don’t have a long record to assess: just over 100 years of data on river flow, and nearly 150 years of rainfall data.
“In that context, missing the most recent 25 years of data means we’re missing a big chunk of certainty.”
Using grants from the Government’s Envirolink fund, and its own resources, NIWA is updating the calculations by including the past 25 years of data, and re-working the original procedures.
The intention is that the calculations will become a dataset in the online Stream Explorer service. Users will be able to click on any waterway to see its flood frequency calculation.
“It’s a very ambitious thing,” Roddy admits. “Our intention is to build a more objective model than the existing flood estimates use.”
Roddy says NIWA’s re-calculations use actual flow data and models to estimate the likelihood of floods across any waterway.
“We pick peak flows from data measuring flow rates in waterways, then find the mean of those. That allows us to estimate the period in which the amount of water exceeds the peak flow.
“We model those flow data across all non-monitored streams, using factors such as rain intensity across the catchment in which the stream lies, differences in land use, and soil make-up. We can improve accuracy by including enough real-world records of similar waterways and catchments.
“That combination will provide us rules to apply to any waterway in any region.”
Roddy says the new calculations will also account for uncertainty. The current flood frequencies are based on the idea that the model is right. The new frequencies will be based on an assumption that even the improved model is imperfect. The result is a more accurate estimate of flood frequency.
The re-calculated flood frequency estimates are expected to be available later this year.
Making change
Knowing when floods will hit, and how hard, is the first half of the solution. NIWA’s Andrew Tait says local government and other owners/operators of buildings, infrastructure and services must use the information to take a ‘risk-based approach’ to managing their systems.
“The likely effect of climate change on extreme events, based on the best available information, should be included in all such risk assessments.
“Practical steps can be taken, based on risk assessments, to reduce community vulnerability to changes in extreme climatic events such as flooding and coastal storms. These should be based on continuous assessment and evaluation of the hazard, and frequent community consultation.
“Options include re-zoning hazardous areas, hardening infrastructure and buildings, upgrading infrastructure such as stormwater pipes and flood protection schemes, raising mandatory floor levels in new developments, and putting in place stronger consenting regulations for building in hazardous locations.”
The Auckland Council agrees, adding that innovation, not over-engineering, could be the most effective way to cope with increasing flood risks in New Zealand.
With urban development accelerating rapidly in New Zealand’s biggest city, incidents of surface flooding are on the rise. Stormwater modelling incorporating climate change data had shown increasing frequency and severity of flood risks in the Auckland region.
Strategic planning team manager Claudia Hellberg says the increasing incidence of surface flooding often led people to demand bigger drains to cope with excess runoff. However, that was an overly simplistic approach.
“Stormwater management is now not just about drainage and the creation of dry land. Stormwater management looks at all the impacts of stormwater runoff on the health and safety of people as well as the environment.
“For example, increased impervious surfaces in an urban environment escalates the volume and peaks of stormwater flows into streams, which leads to increased stream erosion.”
Auckland Council’s response to the problem is its Water Sensitive Design approach, which incorporates stormwater management into each level of development planning.
“This involves the integration of land use and water management to minimise adverse effects on freshwater systems and coastal environments, particularly from stormwater runoff.”
NIWA has assisted Auckland Council’s development of the Water Sensitive Design approach by conducting studies that assess the state of the environment in the Auckland region – required to demonstrate the need for implementing different ways to manage stormwater.
Hellberg says the council’s approach also encompasses the utilisation of natural flow paths to increase resilience for increased flows to be expected in the future as a result of climate change.
A bigger umbrella
Sam Dean says that recent improvement in understanding and forecasting floods is only now beginning to flow into better flood planning and prevention.
“As climate change begins to bite, the public should expect more flooding in the short term.
“Infrastructure built to carry water out of towns and cities is designed for historical amounts of water. As we see increased amounts of rain over short durations, you might see these systems starting to fail more often.
“That’s why it is so important to fine-tune the understanding of flood mechanics, and connect the science to improve flood forecasting.
“The challenge now is to apply what we know about the causes of floods, and the added risks of climate change, to make adaptations in how we live and work,” he says.
Is climate change to blame?
The weather@home project, part of the international climateprediction.net effort, is assessing whether extreme weather events can be attributed to global climate change.
The spare computing power of volunteered computers around the world is used to run high resolution regional climate models enough times to capture very rare weather events.
The New Zealand part of the project, headed by NIWA climate scientist Suzanne Rosier, uses data from regional climate models of the Australian and New Zealand region.
Dr Rosier says that when simulations of actual conditions are compared with those of how things might have been without human influence on the climate, the risk of extreme rainfall such as that which caused the winter 2014 floods in Northland has likely increased as a result of human influence.
More recent extreme rainfall events, such as those in Wellington, Dunedin and Whanganui in the last couple of months, are currently being investigated.
Project results have also shown that the record warm winter of 2013 in New Zealand would have been extremely unlikely without human interference with the climate system.
Misty frequencies
This year Dunedin was said to have experienced a ‘one in one hundred year’ flood. Last year several Christchurch floods were each labelled in the same way.
“This phrase is too loosely and inaccurately used – it drives you mad,” says Roddy Henderson, Group Manager Applied Hydrology at NIWA, of the oft-used expression.
“I can understand the public’s frustration. They will hear that storms of different magnitude, happening three successive months in a row, are all one in one hundred year events.”
A so-called one hundred year flood does not mean that there is one flood of this size every one hundred years. It means that there is a one in one hundred chance that a flood of this size or bigger will happen in any given year.
Therefore, it is statistically possible for the ‘one in one hundred year’ flood to happen back to back.
That’s why NIWA refers to something called the annual exceedance probability (AEP). This is the probability that a river will exceed a given design flood in any given year. Thus, a one per cent AEP flood has a one in one hundred chance of occurring in any given year at a given location.
There is about a 65 per cent chance that there will be at least one one-per-cent-AEP flood in populated catchments of New Zealand in any year. So it is a fair bet that somewhere in New Zealand each year we will see what may be misguidedly called a ‘one in one hundred year flood’.
The ‘one in one hundred years’ phrase is sometimes used to describe only the worst factor of any flood.
For example, early application of the phrase to last year’s Christchurch floods was linked to the extraordinary amount of water collected by a rain gauge at the Botanic Gardens over an 18-hour period.
NIWA Principal Scientist Meteorology Dr Mike Revell said at the time that water collected at other rain gauges around Christchurch indicated storm return periods ranging from one in three years right up to the one in one hundred. Clearly it wasn’t useful to pick just one rainfall gauge to classify the whole storm.
Moreover, the correspondence between storm rainfalls and river flood peaks is not straightforward, so that a rare one per cent AEP rain event doesn’t necessarily mean it was a one per cent AEP flood.
Why do people use the ‘one in one hundred year’ concept if it’s so misleading?
Henderson says the phrase persists because it is in common use in planning, engineering and policy circles.
“It is used to define thresholds for building and infrastructure rules. For example, the height of a floor is sometimes set to avoid a one in one hundred year flood.
“We know that it’s referring to the AEP of the waterway, but the public don’t.”