NIWA meteorologists are monitoring the potential for ex-tropical cyclones to affect New Zealand early next week.
Tropical Cyclone 11P has formed east of Vanuatu and is expected to strengthen rapidly over the next 24-48 hours into Tropical Cyclone Winston.
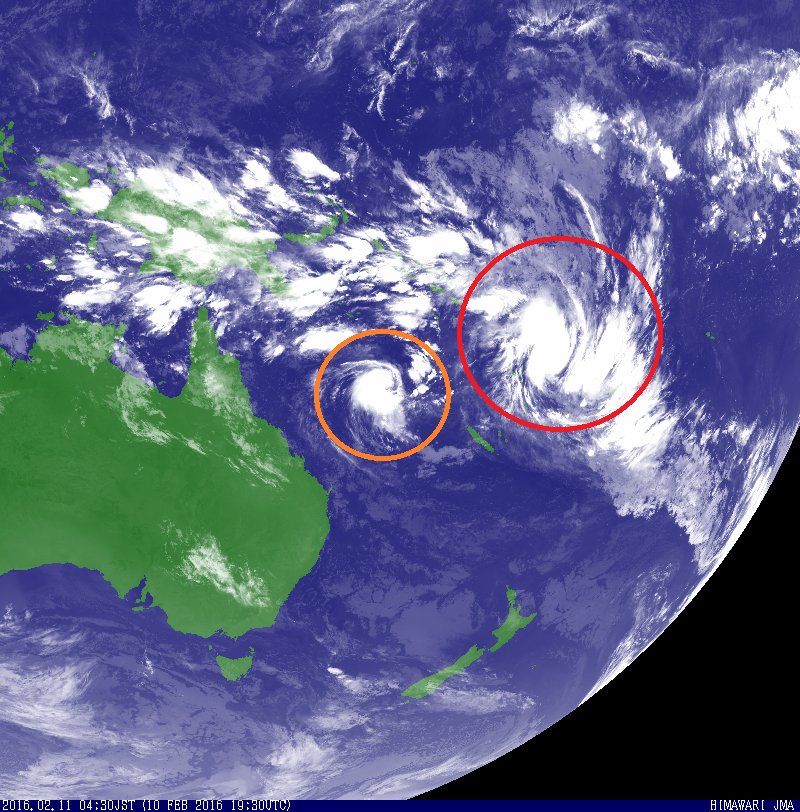
A second cyclone (eventually may be named Yalo) is expected to form in the day or so over the open waters of the South Pacific, about 225km east of Willis Island. On the infrared satellite image below, Tropical Cyclone 11P is circled in red and the second cyclone in orange.
Movement of Tropical Cyclone 11P will be toward the south and east over the open water east of Vanuatu from Thursday into Friday. The second storm will pass just west of New Caledonia from Friday into Saturday.
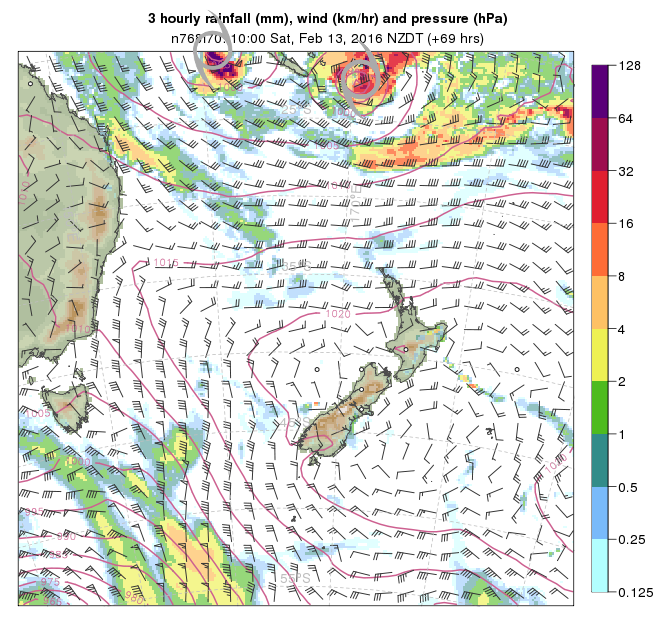
By Saturday morning, both storms have the potential to be formidable tropical cyclones, packing sustained winds of more than 150km/h. Right now, it appears that the pair will pass outside of New Caledonia come Saturday morning – the stronger of the two (likely Winston) to the east by 250-350 km and the other to the west by 200-300 km. The graphic below illustrates the storms’ forecast position at 10am NZDT on Saturday.
Later Saturday and into Sunday, the track of both systems becomes a little less certain, though there is enough confidence to suggest that a turn toward the east is probable, particularly for the first storm (Winston).
This would leave the system well to the north of New Zealand early next week, sparing the country of impact. The second system’s track is less predictable and will be controlled in large part by the behaviour of the bigger storm. It may simply weaken well to the north of New Zealand, or, in a less likely scenario, bring a humid rain with gusty northeasterlies to the North Island mid-week next week.
Meteorologists often use tropical cyclone tracking maps, colloquially known as “spaghetti plots”, to monitor forecast progressions of the weather systems. Below, you’ll see an example of one of these maps. On it, there are 102 different lines, each representing a separate outcome generated by a particular computer model. Notice that a large cluster of the colourful lines are well to the north of New Zealand. You can count on your hands how many outcomes show a New Zealand impact from either storm – about 9 of 102, or about 9%. That is a very low probability.
Nevertheless, Niwa meteorologists consider this a rapidly evolving weather situation with forecast confidence low to medium.
Related news
- Tropical cyclone update #2
- Tropical cyclone update #3
- More News
- Climate news
- Our climate services
- Our climate work
- Our climate publications