PDF of this article (200 KB)

Thomas Wilding
A study of almost 700 invertebrate samples from around New Zealand is helping to extend our understanding of stream ecosystems.
Water managers in New Zealand are increasingly using invertebrates to monitor stream health, encouraged by initiatives such as the Ministry for the Environment’s national sampling protocol. But as the use of invertebrates as a monitoring tool becomes more widespread, the limits of our understanding become more of an issue. For example, the macroinvertebrate community index (MCI) was originally developed for assessing organic pollution in Taranaki ring-plain streams. Applying this method to other parts of the country has provided some excellent results, but there are pitfalls. For example, do invertebrate communities respond in the same way to development regardless of stream type or the form of pollution?
Back to basics

Before attempting to answer this question, we decided to take a step back and simply look at what invertebrate communities exist in New Zealand streams and rivers. We didn’t confine the study to any land use or substrate type, but just tried to get a picture of what is out there. We looked at what characterises invertebrate communities and how they compare to our own preconceptions of the invertebrate communities that inhabit certain types of stream. This provides a more objective basis for the next stage of this research: teasing out the catchment variables that mould these communities. A national invertebrate dataset was collated from various studies of North and South Island streams, totalling 697 sites from 26 different studies (by NIWA, Environment Canterbury, and others). We used multivariate analysis to classify the stream communities into categories. Then we compared the categories using MCI and %EPT, indices commonly used to compare pollution tolerance. The latter is the percentage of Ephemeroptera (mayflies), Plecoptera (stoneflies), and Trichoptera (caddisflies.)
Eight communities identified

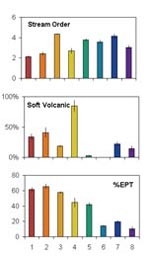
We found a clear distinction between invertebrate communities typical of “lowland”, or low-gradient pasture streams, and those typical of “upland”, or high-gradient streams draining mixed land uses. Indicator species for the lowland stream group included snails, sphaerid clams, and seed shrimps, which are most common in slower flowing streams with silt and macrophyte substrates. For the upland streams, indicator species are more typical of swift, cobble streams and rivers (for example, toebiter, spiny mayfly). The distinction of these two groups is supported by the MCI and %EPT, with lower values on average for the lowland streams. This is logical given that both indices reflect community composition. Invertebrate communities were further divided into 8 classes, with classes 1–4 making up the upland group and classes 5–8 the lowland group. The bar graphs (right) illustrate some of the divisions we found.
Upland stream classes
Classes 1 and 2 match the communities we associate with small headwater streams in native bush catchments. Typical representatives include the larvae of mayflies such as Acanthophlebia and Neozephlebia, and the larvae of the caddisfly Orthopsyche. Class 3 included the greatest number of sites (326) and appears to represent the typical cobble-river communities that are so often sought for conventional invertebrate sampling (including the mayfly Deleatidium, elmid beetles, net-spinning caddisfly larvae, and stony-cased caddisfly larvae). Class 4 was a small group of sites with depauperate invertebrate communities (East Cape sites heavily affected by siltation, and Tokoroa samples collected from inhospitable pumice beds).
Lowland stream classes
Classes 5, 6, and 7 had various abundances of stony-cased caddisflies, smooth-cased caddisflies or net-spinning caddisflies, all of which are more typical of upland streams. Thus these classes may include some sites that have the potential to support upland stream communities, but were prevented from doing so by land-use effects. Class 8 communities were typical of lowland streams with invertebrates that are associated with macrophyte beds and low water velocities (for example, snails, worms, and non-biting midges).
Catchment features
Catchment variables can influence invertebrate communities both directly and indirectly. For example, greywacke catchments often have hard, shallow bedrock and steep topography. The rain runs off this ground quickly, producing more severe flood disturbance. Greywacke typically produces cobble-bed streams with swift flow. These features are important drivers of invertebrate habitat. Whether they act directly or indirectly, we want to measure those catchment variables that allow us to predict what invertebrates are likely to live in a stream.
Describing the catchment features of so many sites is normally an overwhelming task. Fortunately NIWA has developed the River Environment Classification network (see box). Using this system, we can generate a whole range of catchment variables for any stream in New Zealand. The graphs show some variables plotted for each of the eight classes identified from the invertebrate data. These plots show, for example, that sites in the lowland group (classes 5–8) have a lower gradient and higher proportion of farming in their catchments. This group also had a higher proportion of alluvial geology. Several of the upland classes have a higher proportion of soft volcanic rock. The class with the most sites, Class 3, represents larger streams (fourth order on average) that originate in steep areas (high catchment gradient, lower section gradient), often draining hard-sedimentary geology (such as greywacke).
Next step
The next stage of this research will examine these communities in order to identify the catchment and habitat features that affect them most. One aim is to be able to separate land-use effects from natural habitat differences.
Distinct community or sampling method?
A conglomeration of invertebrate data was used for this study. It needs to be asked: what effect did sampling method have on site classification? The Environment Canterbury samples were collected using a dip-net and the 227 sites cover both upland and lowland stream types. These samples were divided half-and-half between the upland and lowland group, suggesting the classes identified by this analysis probably reflect the invertebrate community rather than the sampling method. Most other methods are designed for particular stream types (for example, the Surber method for cobble streams) so, not surprisingly, do not identify as many stream types if considered on their own. (See “Measuring stream invertebrate biodiversity” in Water & Atmosphere 9(3) for examples of invertebrate sampling methods.)
River Environment Classification
The REC classifies individual sections of rivers and streams according to climate, topography, geology, and land cover of each section’s unique upstream watershed. Underlying these four categories (climate, topography, geology, and land cover) is a multitude of physical variables that were mapped for the whole country. Spatial information such as geological maps and the land-cover database were the source for much of the information. For other variables, models were developed to predict values (such as rainfall, flow) for every catchment in the country. Rather than using the final REC classification, this invertebrate classification study used the raw data that the REC is based on to describe each catchment.
Teachers’ resource for NCEA AS: Biology 2.5, 2.6, 2.9, 3.1; Geography 3.1. See other curriculum connections at www.niwa.co.nz/pubs/wa/resources
Thomas Wilding is based at NIWA in Hamilton.
