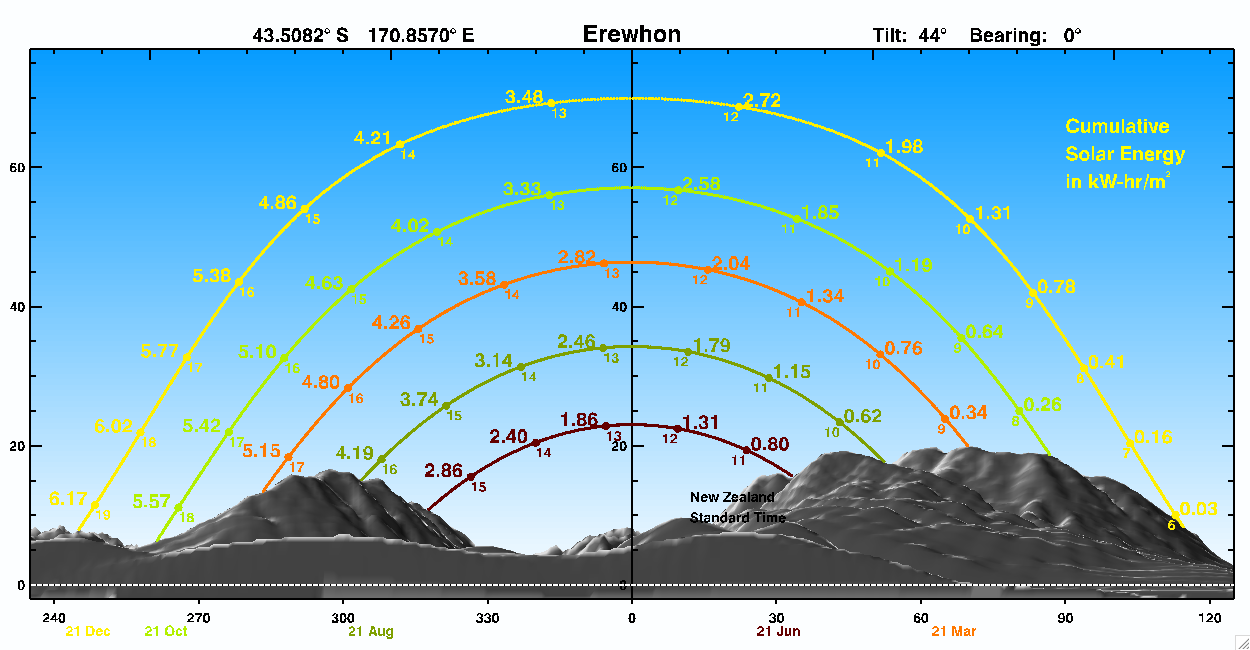
Graphic image of a graph over image of a horizon landscape showing 5 curves that indicate the path of the sun on 1 Dec (summer solstice) , 21 Jun (winter solstice), 21 Mar (autumn equinox), 21 Aug & 21 Oct and the numbers on different points of the curve indicate how much solar energy is available on that day.