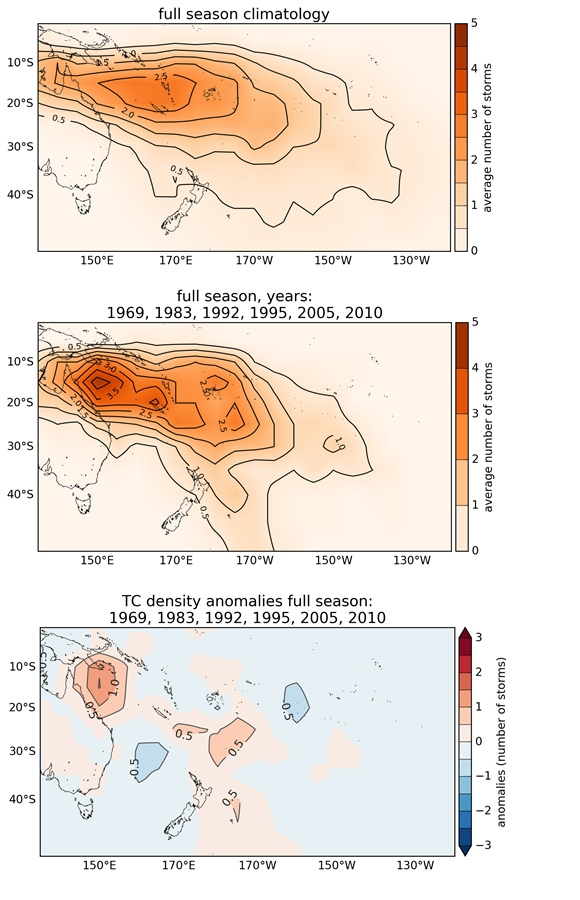
Figure 2: Number of TCs occurring for the full season (November – April) in the Southwest Pacific (135°E to 120°W): (top panel) average number over 1981 to 2010 (normal); (centre panel) average number over selected five analog seasons (Table 1); (bottom panel) departure from normal for the analog seasons (difference between count in centre and top panels). For each year noted, that represents the start of the full season (i.e. 1969 = November 1969-April 1970)

